Best Gantt & Roadmapping Tools for Jira: A 2025 Comparison
Marek Lewandowski
Best Gantt & Roadmapping Tools for Jira: A 2025 Comparisonhttps://geniusgecko.com/wp-content/uploads/2025/10/gantt_1-1.png10241024Marek LewandowskiMarek Lewandowskihttps://secure.gravatar.com/avatar/b30832b12503a19cf1e849a6ff1fb663?s=96&d=mm&r=g
Look, picking the right Project Portfolio Management (PPM) tool for your Jira setup is a huge deal—it’s not just another piece of software. It’s the strategic decision that determines how fast, flexible, and scalable your whole organization can actually be, effectively linking your big-picture strategy to execution.
The truth is, an awesome Jira PPM app has to do way more than just generate a simple, static Gantt chart. It needs deep, integrated functionality for core project portfolio management features, like rock-solid resource capacity planning, smart project prioritization, and truly transparent, real-time reporting across all your teams.
That’s why we did the heavy lifting for you. This guide is your definitive, no-fluff comparison of the market’s top Gantt and Roadmapping tools for Jira. We’re drilling down into the core PPM features to see how the biggest players stack up:
PPM Features: Your Non-Negotiable Checklist for Jira Success
Think of this detailed feature-by-feature rundown as your ultimate checklist for picking the right Jira PPM software. Behind every point is a solution to a real headache for a Project Manager (PM) or a stakeholder.
We’re going to break down exactly why these core features are so critical for successful portfolio management, looking at the cold, hard numbers (ROI) and the actual operational impact they’ll have on your engineering and business teams.
Are you already feeling the cost of a bottlenecked, under-optimized setup?
Reading a comparison is one thing, but fixing the hidden problems in your current workflows and toolstack is where the real money is saved. Before you commit to a new tool, make sure your transformation is set up for success.
We’ve opened up exactly 2 slots this month for a free 15-minute “Is This Fixable?” call. Let’s quickly diagnose your situation, pinpoint the bottlenecks costing you time and money, and see if we can get you on the right track with a 90-day plan blueprint.
Automatic task start/end date updates (dependencies and parent-child relations)
(5 / 5)
(3 / 5)
(3 / 5)
(3 / 5)
(3 / 5)
(2 / 5)
SUMMARY
31 / 35
25,5 / 35
22 / 35
25 / 35
17/ 35
15 / 35
Other
Resources
(2 / 5)
(4 / 5)
(3 / 5)
(4 / 5)
(3 / 5)
(2 / 5)
Warnings
(4 / 5)
(5 / 5)
(3 / 5)
(3 / 5)
(4 / 5)
(3 / 5)
Non-user resources
(2 / 5)
(3 / 5)
(1 / 5)
(4 / 5)
(1 / 5)
(1 / 5)
Issue search and filtering
(5 / 5)
(3 / 5)
(3 / 5)
(2 / 5)
(3 / 5)
(2 / 5)
Adding columns
(4 / 5)
(5 / 5)
(3 / 5)
(3 / 5)
(3 / 5)
(2 / 5)
In-line editing
(4 / 5)
(4 / 5)
(3 / 5)
(3.5 / 5)
(3.5 / 5)
(3.5 / 5)
Formulas/auto-calculations/aggregations
(3 / 5)
(5 / 5)
(2 / 5)
(2 / 5)
(2 / 5)
(2 / 5)
Reports
(2 / 5)
(3 / 5)
(2 / 5)
(3.5 / 5)
(3.5 / 5)
(3.5 / 5)
Milestones
(4.5 / 5)
(4 / 5)
(4 / 5)
(4 / 5)
(1 / 5)
(1 / 5)
Change history
(4 / 5)
(2 / 5)
(2 / 5)
(2 / 5)
(2 / 5)
(2 / 5)
Sync with Jira issue
(3.5 / 5)
(3 / 5)
(3 / 5)
(3 / 5)
(3 / 5)
(3 / 5)
Import / Export
(1 / 5)
(3 / 5)
(3 / 5)
(2.5 / 5)
(3 / 5)
(3 / 5)
Gadgets
(3 / 5)
(3 / 5)
(1 / 5)
(1 / 5)
(1 / 5)
(1 / 5)
Shortcuts
(3 / 5)
(1 / 5)
(2 / 5)
(2 / 5)
(3 / 5)
(3 / 5)
Live sync
(4 / 5)
(4 / 5)
(1 / 5)
(1 / 5)
(1 / 5)
(1 / 5)
Documentation
(2 / 5)
(3.5 / 5)
(3 / 5)
(3 / 5)
(5 / 5)
(3.5 / 5)
Portfolio planning
(4 / 5)
(2 / 5)
(1 / 5)
(3 / 5)
(3 / 5)
(1 / 5)
Permissions
(4 / 5)
(3 / 5)
(1 / 5)
(2 / 5)
(1 / 5)
(3 / 5)
UI / UX
(3.5 / 5)
(3 / 5)
(2 / 5)
(3 / 5)
(4 / 5)
(4 / 5)
Limitations
(4 / 5)
(4 / 5)
(3 / 5)
(3 / 5)
(2 / 5)
(1 / 5)
Performance at Scale:
(4 / 5)
(3.5 / 5)
(3 / 5)
(3 / 5)
(3 / 5)
(3 / 5)
Summary Others
(70.5 / 105)
(71 / 105)
(49 / 105)
(57 / 105)
(55 / 105)
(48.5 / 105)
FINAL SCORE
101.5 / 140
72%
96.5 / 140
69%
71 / 140
51%
83 / 140
59%
72 / 140
51%
63.5 / 140
45%
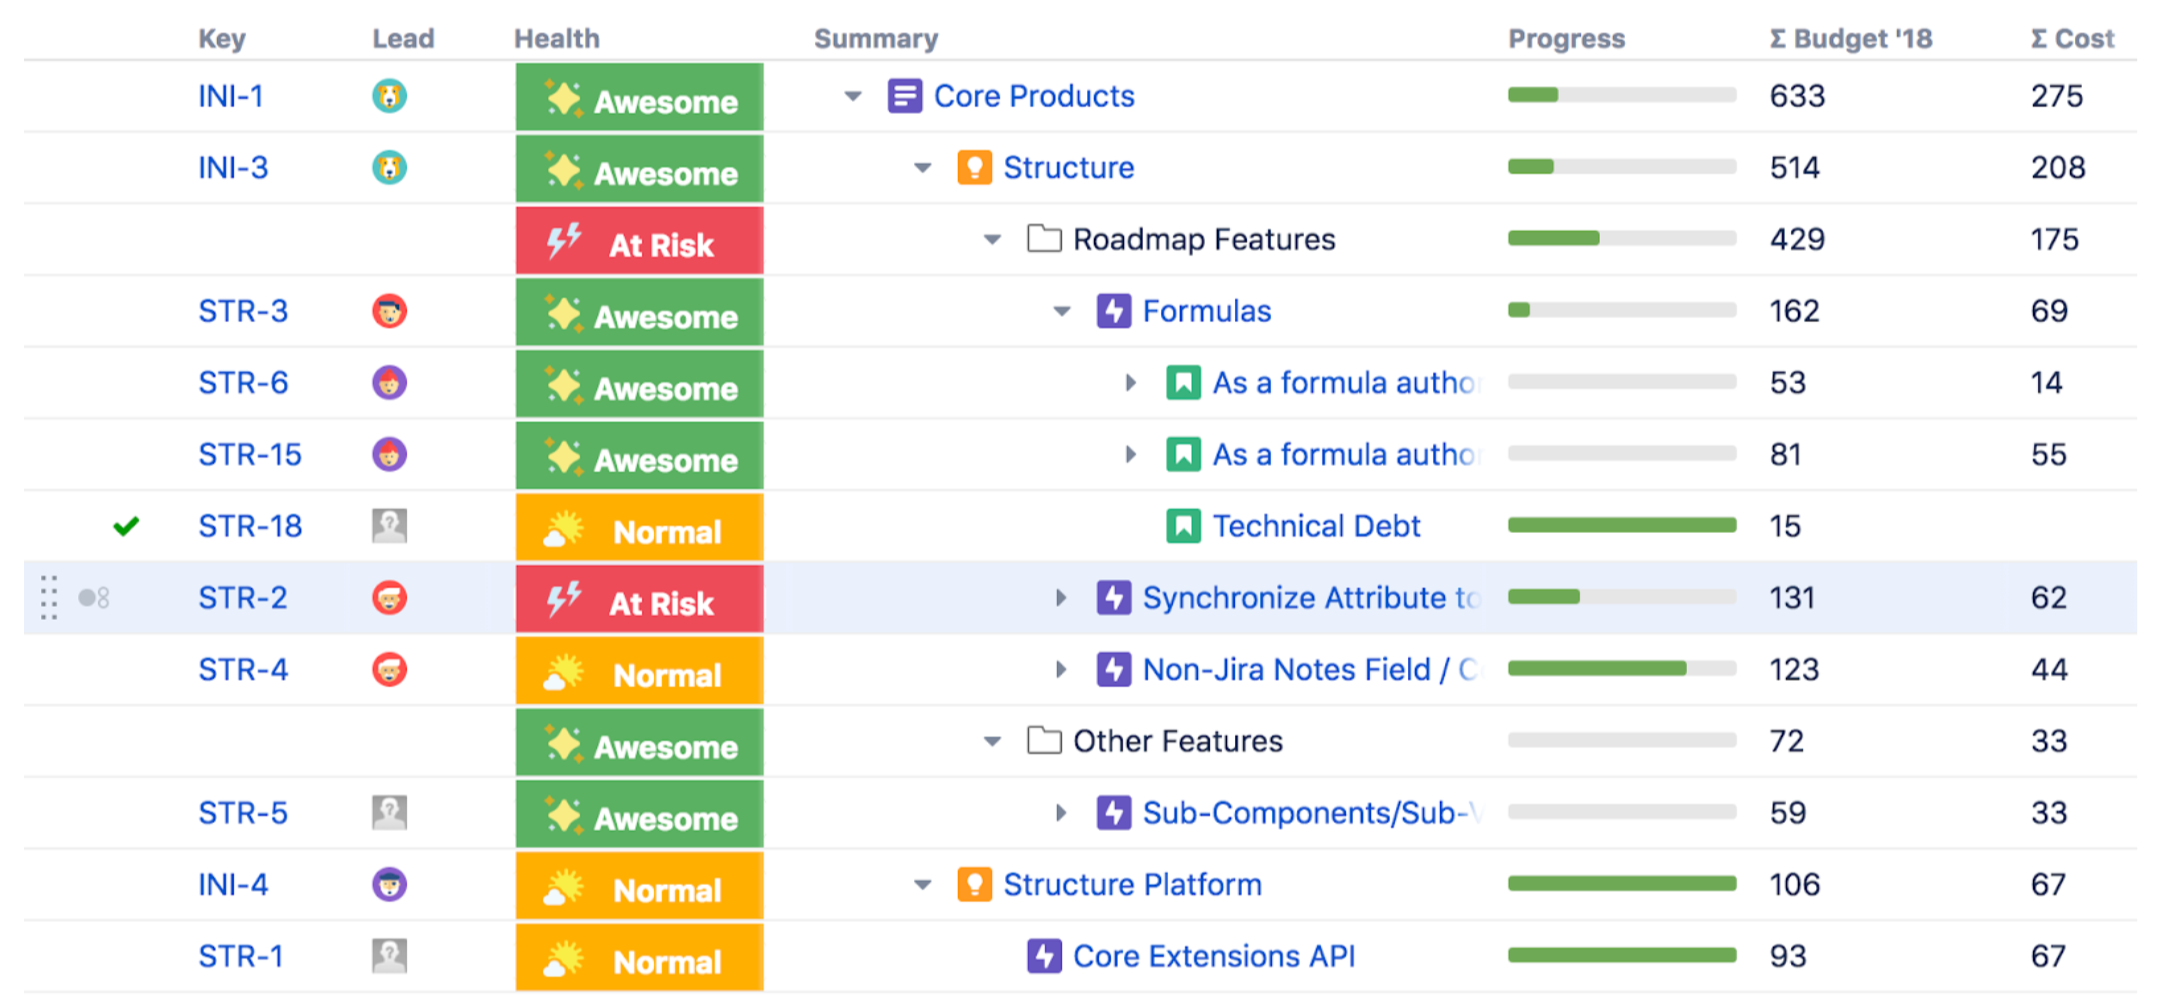
The Definitive Ranking of Jira Gantt & Roadmapping Tools: BigGantt and Structure Lead the Pack
In our final, comprehensive analysis of the best Jira Gantt chart and roadmapping tools, two solutions clearly emerged as the market leaders, excelling in both core scheduling and advanced Project Portfolio Management (PPM) features. BigGantt secured the top spot with an impressive 101.5/140 (72%), validating its robust features for complex project scheduling, including What-If Scenarios and Critical Path visualization. Right behind it is Structure + Structure.Gantt with a powerful 96.5 /140 (69%), proving its unmatched capability in data aggregation and building deep, flexible Work Breakdown Structures (WBS) across multiple projects.
The mid-range contenders—Jira Plans (51%) and WBS GanttP (51%) and ProScheduler (59%) —offer solid, specialized functionality but fall short of the leaders in overall breadth and depth. The basic, native solution, Jira Timeline (45%) is suitable only for simple, single-team visualization. For organizations serious about enterprise-scale planning, resource management, and strategic roadmapping within Jira, the choice is clear: BigGantt and Structure + Structure.Gantt deliver the most complete and effective solutions on the Atlassian Marketplace.
Keep reading for a detailed, category-by-category analysis of how each tool stacks up across Gantt essentials, resource management, and PPM features.
I. Financial Viability and Adoption
Pricing
Beyond the absolute cost, pricing determines the barrier to entry. Tools offering a Free up to 10 users tier facilitate pilot programs and adoption by small teams. For large-scale enterprises, the per-user cost at volume (e.g., 1000 users) becomes the critical factor for long-term ROI.
Atlassian Marketplace listing page – the central platform where users find and purchase apps, showcasing features like user ratings, vendor details, and pricing for tools like BigGantt, Structure, and WBS Gantt-Chart. It emphasizes the trusted source for extending Jira’s functionality with top-rated Project Management and Gantt solutions.
Jira Tool
Small Team (10 Users)
Medium Team (100 Users)
Large Team (1000 Users)
Price Tier Summary
BigGantt
Free up to 10 users
$182 / Month ($1.82/user)
$692 / Month ($0.69/user)
Highly Competitive. Free for small teams, excellent per-user cost at scale.
Structure + Structure.Gantt
Not Free. Requires Structure and Structure Gantt
$473 / Month
($4.73/user)
$3005 USD / Month
($3/user)
High Upfront Cost. Requires purchase of two separate, premium apps. No free tier.
WBS Gantt
Free up to 10 users
$125 / Month ($1.25/user)
$590 / Month ($0.59/user)
Most Cost-Effective. Free for small teams, lowest per-user cost at scale.
Pro scheduler
Free up to 10 users
$150 / Month ($1.50/user)
$675 / Month ($0.68/user)
Strong Value. Free for small teams, very competitive mid-range pricing.
Jira Plans (Advanced Roadmaps)
Not Free. Requires Jira Premium or higher
Included in Jira Premium plan
Included in Jira Premium plan
High Entry Barrier. Cost is the Jira Premium fee (approx. $13.53 – $17/user/month) for all Jira users.
Jira Timeline
Free
Included in Jira Free/Standard
Included in Jira Free/Standard
Free/Built-in. Available in Jira Free/Standard tiers for all users.
Finding the Best Value: A Jira Gantt Chart App Price Comparison
When choosing a Jira Gantt chart app, understanding the pricing tiers is crucial. This comparison of popular tools highlights the most cost-effective and premium options for teams of all sizes.
Cost-Effective Choices for Small Teams (Up to 10 Users)
For small teams, the good news is you have several excellent free Jira Gantt options:
Free Built-in Option:Jira Timeline is the absolute cheapest option—it’s included for free in Jira Free/Standard tiers.
Best Free Apps:BigGantt, WBS Gantt, and Pro scheduler all offer a generous free tier up to 10 users, allowing small teams to get powerful features at no cost.
Best Value for Large Enterprises (1,000 Users)
When scaling to 1,000 users, the dedicated marketplace apps deliver significant per-user savings compared to native Jira plans:
The Budget Champion:WBS Gantt is the most cost-effective choice, costing only $0.59 per user per month.
Highly Competitive:BigGantt and Pro scheduler also offer excellent, low per-user costs at scale, making them strong contenders for large deployments.
The Premium and High-Cost Options
Extremely Expensive Outlier:Structure + Structure.Gantt is the most expensive and complex solution. It is priced at $473 per month for a medium team (100 users) and a massive $3005 USD per month for a large team (1000 users). It has no free tier and requires the purchase of two separate premium licenses, resulting in the highest upfront and ongoing cost.
High Entry Barrier:Jira Plans (Advanced Roadmaps) is a native tool but requires upgrading all Jira users to the Jira Premium plan (approx. $13.53 – $17/user/month), making it a high-cost option for teams that only need Gantt functionality.
By analyzing these tiers, teams can find the perfect Jira app that balances powerful Gantt chart features with their budget needs.
Rating & Installations
These metrics reflect market trust and product maturity. A high Rating suggests user satisfaction and quality support, while a high number of Installations confirms that the tool is proven across diverse environments and scales, minimizing deployment risk.
An image showcasing WBS Gantt-Chart for Jira (ProScheduler) on the Atlassian Marketplace, highlighted by its highest customer rating among comparable Gantt apps. This visual emphasizes its strong user satisfaction, reflecting excellent performance for Jira Project Management, robust WBS planning, and reliable Gantt chart functionality within enterprise environments.
Jira tool
Rating
Install Count
BigGantt
2.8/4
7,03
Structure.GanttWBS
3.4/4
7,023
WBS Gantt
2.8/4
6,743
Pro scheduler
3.5/4
3,968
Jira Plans
?
?
Jira Timeline
?
?
Want to know which Jira Gantt chart plugin users actually prefer? We checked the marketplace ratings and install counts to find the most popular and best-loved options.
User Ratings: Who’s the Fan Favorite?
When users talk, they really like ProScheduler! It snags the highest rating at 3.5/4, showing high user satisfaction with the tool.
Structure (paired with the Gantt add-on) is right on its heels with a fantastic 3.4/4 rating. Users appreciate its flexible portfolio management foundation.
The other major contenders, BigGantt and WBS Gantt-Chart for JIRA, both sit at a solid 2.8/4. They might not get as many rave reviews as Structure or GanttPRO, but they get the job done for a massive user base.
(Note: Native Jira tools like Jira Plans (Advanced Roadmaps) and Jira Timeline don’t have separate public ratings since they are built-in features of the Jira platform.)
Market Adoption: The Most Popular Jira Apps
The popularity contest is close! BigGantt currently has the most installations at 7,030, making it the most adopted third-party Gantt solution in the Jira ecosystem.
Structure is just behind with 7,023 installations, cementing its spot as a leading foundation for anyone doing serious portfolio work in Jira.
WBS Gantt-Chart for JIRA is a close third with 6,743 installations, proving its popularity, especially among project managers who like a traditional Work Breakdown Structure (WBS) feel.
GanttPRO, despite its high rating, is currently the smaller player in terms of market share with 3,968 installations.
The Bottom Line for PMOs: All the data points to a strong preference for the advanced features offered by Structure and BigGantt, which dominate the install count, while GanttPRO is praised for its quality features and high user satisfaction.
Documentation
Comprehensive documentation ensures that users can effectively adopt the tool, reducing reliance on expensive external consulting and accelerating the time-to-value.
Exploring the Atlassian Official Documentation for Jira Plans (Advanced Roadmaps). This resource offers comprehensive, detailed guides and tutorials, backed by extensive Atlassian Community support. However, users should note that planning resources are often spread across different Atlassian help centers, potentially requiring multiple searches for a complete solution to Jira strategic planning queries.
Jira Tool
Documentation Score (Max ⋆⋆⋆⋆⋆)
Documentation Strength
Key Limitation / Factor
Jira Plans (Advanced Roadmaps)
⭐⭐⭐⭐⭐ (Top Score)
Atlassian Official Documentation. Comprehensive guides, tutorials, and extensive community support.
Documentation is integrated across different Atlassian help centers, requiring multiple searches.
Jira Timeline
⭐⭐⭐⭐
Atlassian Official Documentation. Clear, consistent, and well-integrated within the Jira interface.
Focuses on basic features; relies heavily on general Jira help for underlying concepts.
Structure + Structure.Gantt
⭐⭐⭐⭐
High-Quality Vendor Documentation. Extensive library of use cases, formulas, and deep-dive technical guides.
May be overwhelming for beginners due to the sheer volume and technical depth of the content.
WBS Gantt-Chart for JIRA
⭐⭐⭐
Solid Feature Documentation. Clear guides for primary features (WBS creation, Gantt view, MS Project export).
Tutorials are often functional-focused, lacking deeper strategic use cases or modern UI polish.
ProScheduler
⭐⭐⭐
User-Friendly Documentation. Clear, often video-based, tutorials focusing on the core scheduler features.
Less depth on advanced integration points compared to enterprise-focused alternatives.
BigGantt
⭐⭐
(Lowest)
Adequate Feature Guides. Covers how to use specific functionalities but often scattered or less centralized.
Documentation quality is inconsistent; users frequently need to search vendor blogs or forums for solutions.
II. Planning Fundamentals and Hierarchy
Multi-Level Hierarchy
Since native Jira is often limited to three levels, a core requirement for PPM is the ability to create multi-level, custom hierarchies (Portfolio > Program > Project > Epic). This is essential for achieving a meaningful data roll-up, connecting high-level strategy to daily tasks, and generating management reports.
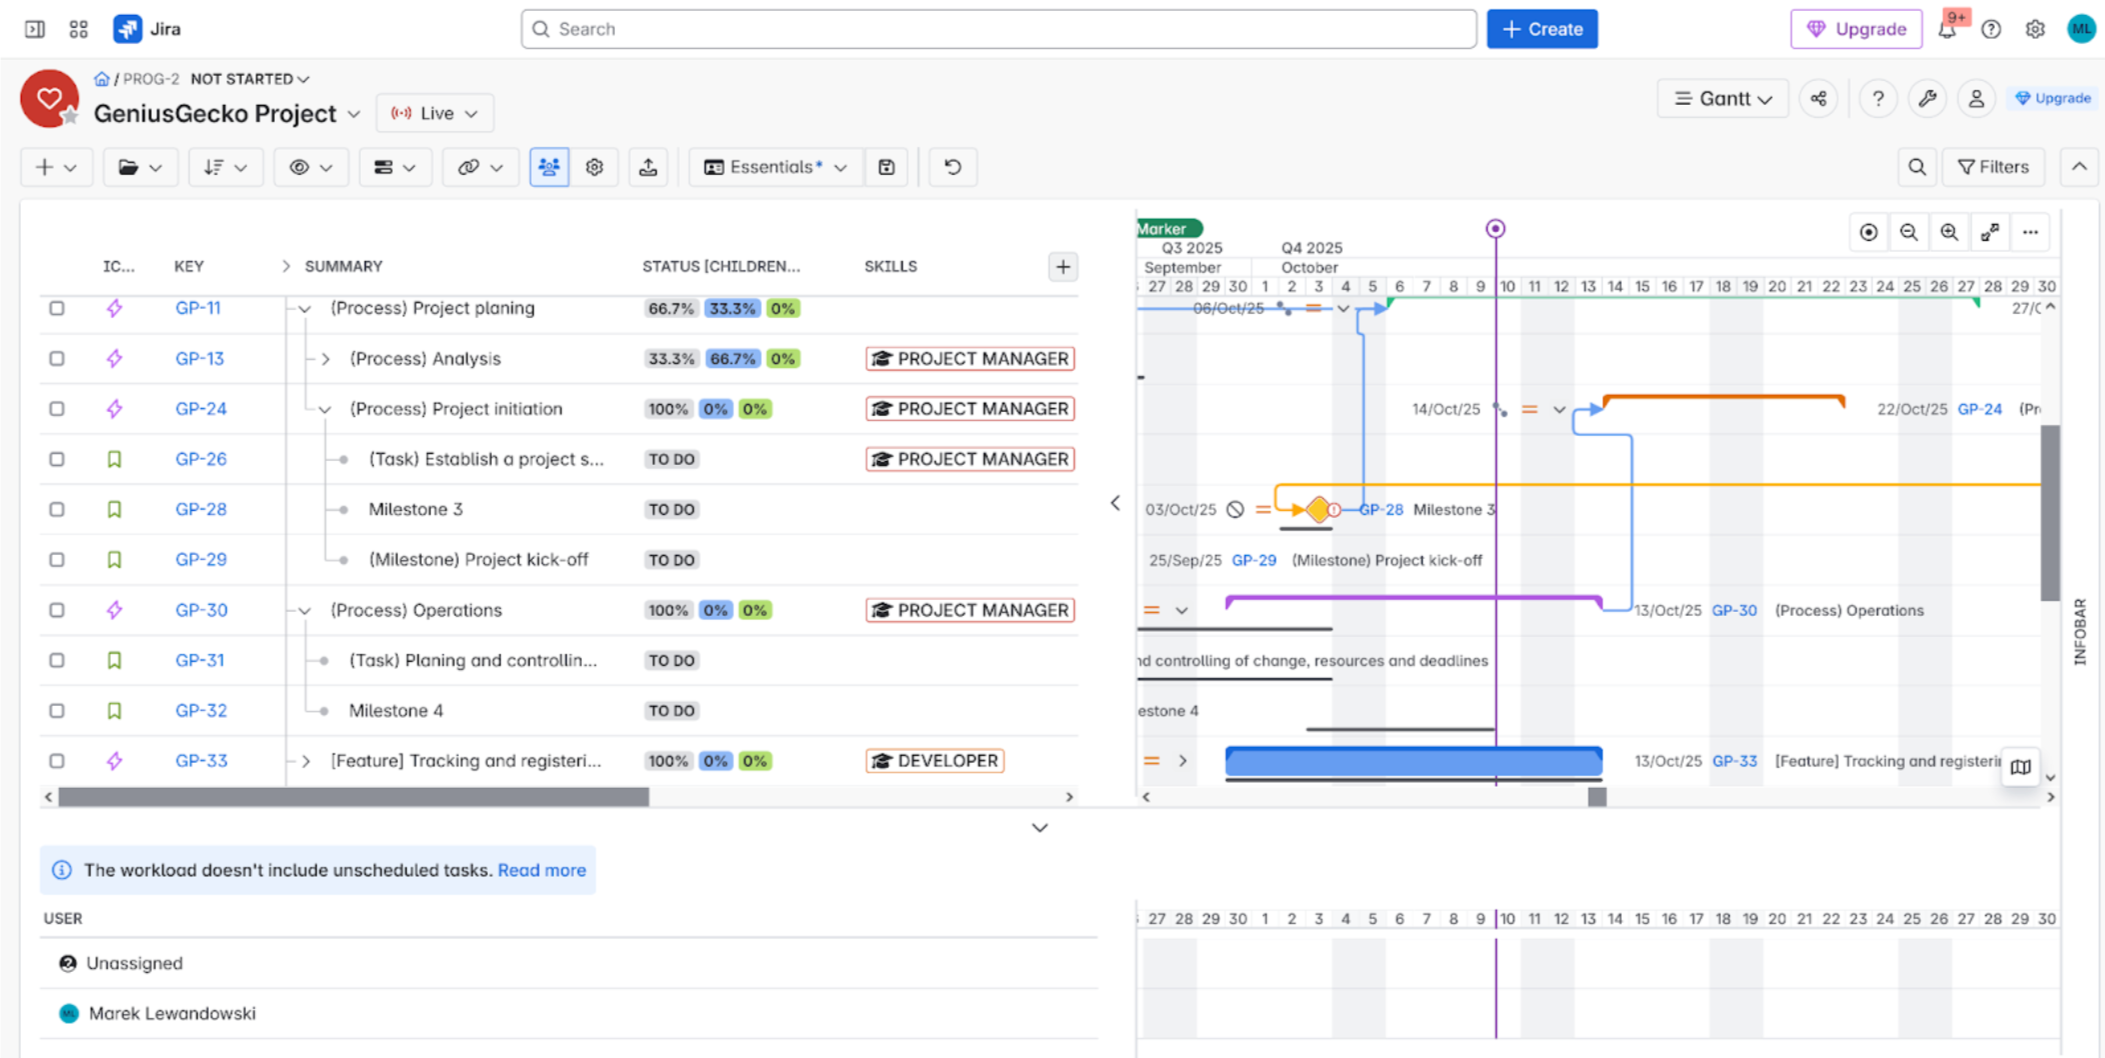
Visualizing the highly flexible hierarchy view in BigGantt for Jira. This feature offers unlimited levels for task breakdown, accommodating structure both above the Epic level (for strategic portfolios) and below (for detailed sub-tasks). Achieve unmatched flexibility for Jira roadmapping and build any custom Work Breakdown Structure (WBS), easily scaling to any project size or methodology.
Jira Tool
Custom Hierarchy Score (Max ⋆⋆⋆⋆⋆)
Flexibility for PMOs
The Verdict on Structure
Structure + Structure.Gantt
⭐⭐⭐⭐⭐
(Top Score)
MAXIMUM. Easily maps any custom organizational model.
The most flexible option for complex portfolios.
BigGantt
⭐⭐⭐⭐⭐
(Top Score)
MAXIMUM. Excellent for creating non-standard, multi-level structures.
Tie for the best solution for hierarchy needs.
Jira Plans (Advanced Roadmaps)
⭐⭐⭐
MEDIUM. Allows levels above Epic, but often limits structure.
Okay for standard use, but lacks true flexibility.
Jira Timeline
⭐⭐⭐
LOW-MEDIUM. Focused on simple team-level scheduling.
Too simple for complex, enterprise-level hierarchies.
WBS Gantt-Chart for JIRA
⭐⭐⭐
MEDIUM. Good for WBS, but can be rigid outside of standard models.
Good for a classic WBS, but not as free-form as the leaders.
For any organization tackling large, complex portfolios in Jira, the ability to define a custom hierarchy—beyond the simple Epic → Story default—is crucial. This is where the difference between native Jira features and dedicated apps really shows up!
The Top Tier: Ultimate Flexibility
Two third-party apps completely dominate this space with a perfect ⋆⋆⋆⋆⋆ score: Structure + Structure.Gantt and BigGantt.
Why are they the best? They offer superior flexibility for creating non-standard, link-based structures that perfectly map to any complex organizational or reporting model you have. If your portfolio management office (PMO) needs true customization to see the “Big Picture” exactly your way, these are the essential solutions.
The Mid-Tier: Standard Structures Only
Atlassian’s native solutions, Jira Plans (Advanced Roadmaps) and Jira Timeline, along with the popular WBS Gantt-Chart for JIRA, settle in the ⋆⋆⋆ range.
These tools can create levels above the Epic, but they often restrict you to more rigid, standard structures. They are sufficient for basic roadmaps but fall short when you need to perfectly model a highly specific enterprise-scale or hybrid portfolio.
Bottom line: For true enterprise-scale, customized portfolio management, you simply have to invest in a leading third-party solution like Structure or BigGantt. The native tools just can’t keep up with complex hierarchy needs.
Waterfall Support
While Agile dominates, large, complex initiatives (e.g., infrastructure, compliance) still rely on Waterfall. A capable PPM tool must accommodate both Agile and Classic methodologies, providing fixed-date planning and scheduling capabilities.
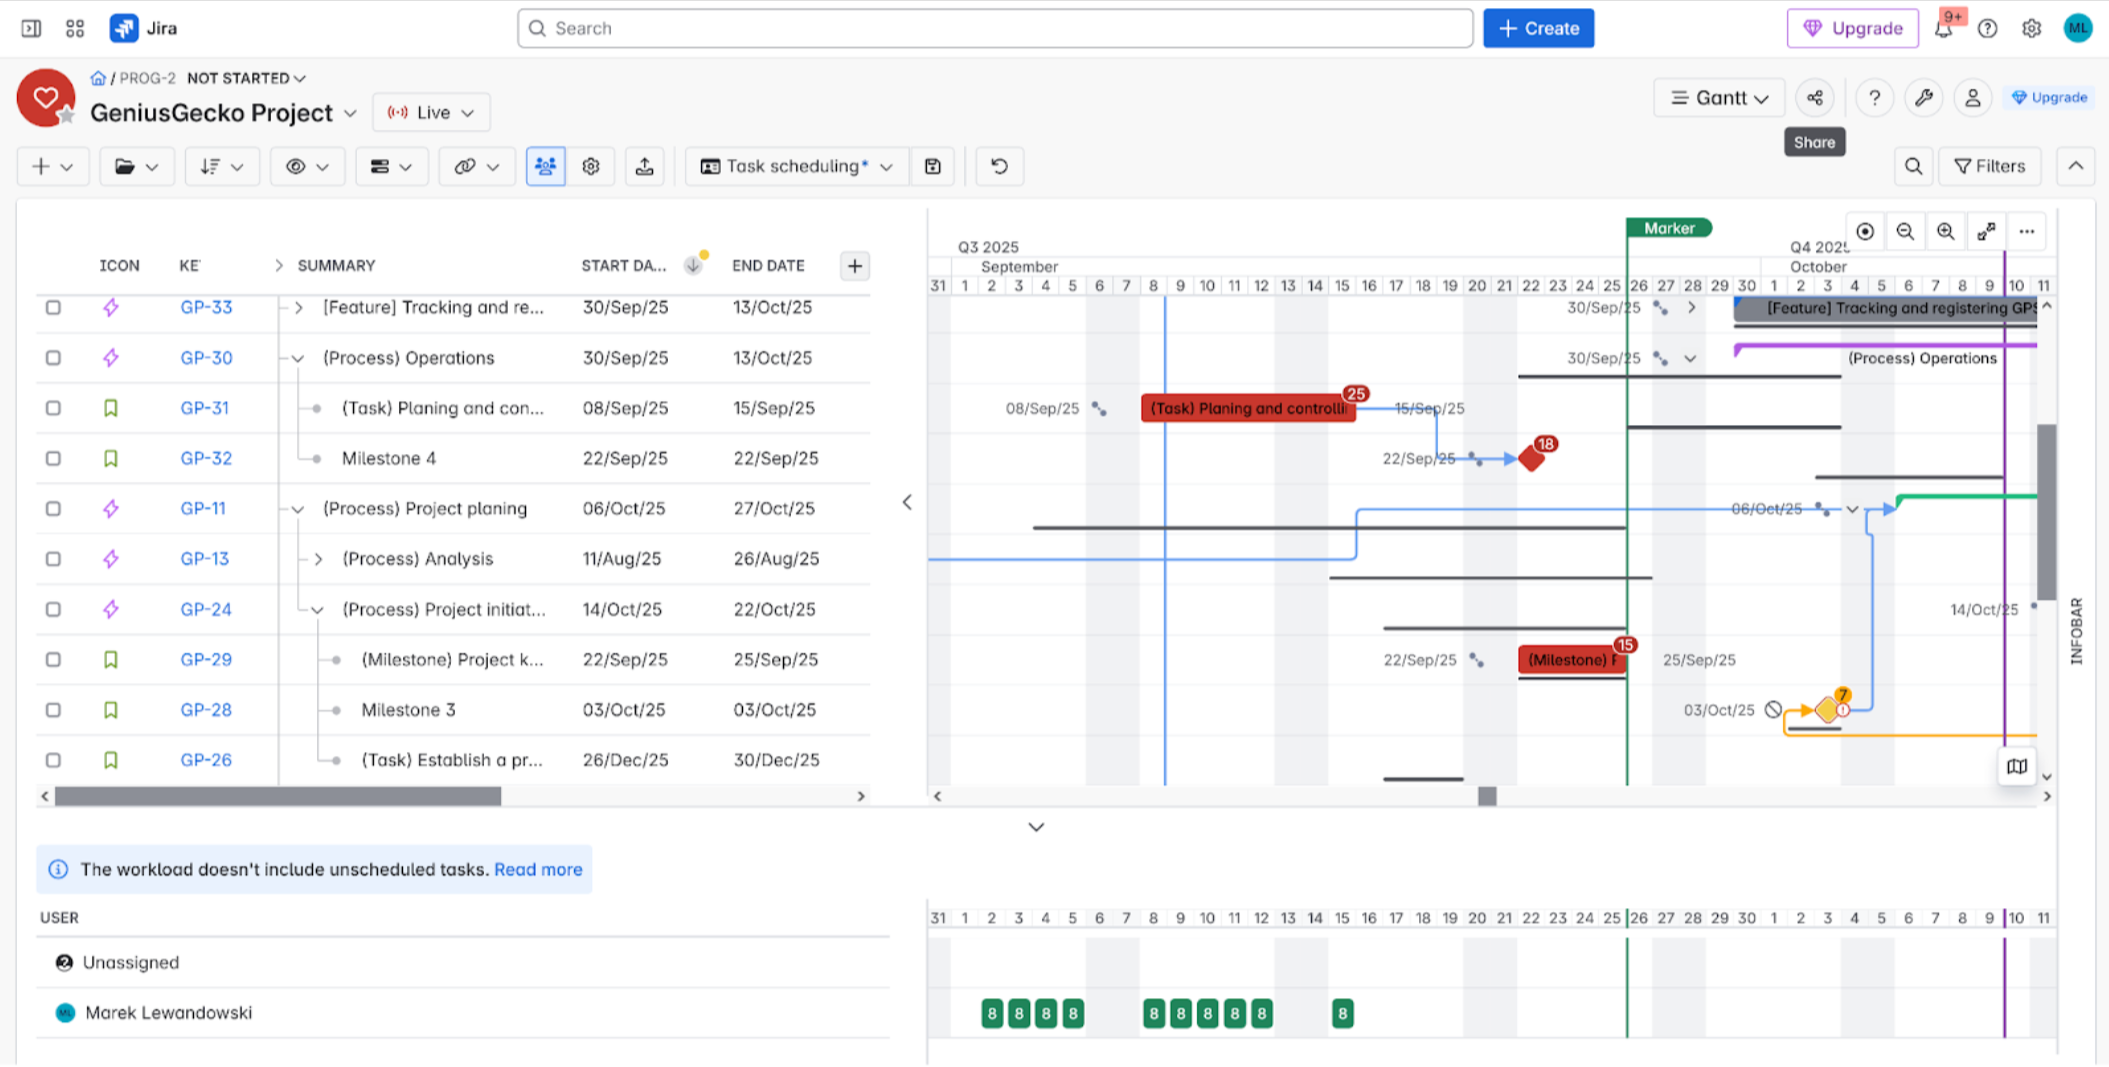
Screenshot of a Waterfall project in BigGantt for Jira, clearly displaying robust dependencies, key milestones, and hierarchical task breakdown. This visual powerfully illustrates BigGantt’s strength in managing traditional, phase-based projects, ensuring Jira Project Managers have full control over complex sequences and project progress.
Jira Tool
Full Waterfall Support?
Advanced Dependencies (SS, EE)?
PMO Takeaway
Waterfall/Dependency Rating
BigGantt
YES
YES
Full control over complex project logic.
⭐⭐⭐⭐⭐ (5/5)
Structure + Structure.Gantt
YES
YES
Excellent for detailed, deterministic scheduling.
⭐⭐⭐⭐⭐ (5/5)
WBS Gantt-Chart for JIRA
YES
YES
Built for traditional WBS and Waterfall needs.
⭐⭐⭐⭐⭐ (5/5)
ProScheduler
YES
YES
External app with professional-grade dependency tools.
⭐⭐⭐⭐⭐ (5/5)
Jira Plans (Advanced Roadmaps)
Limited
NO
Lacks critical advanced dependency types.
⭐⭐⭐ (3/5)
Jira Timeline
Limited
NO
Too basic for true fixed-schedule Waterfall.
⭐⭐⭐ (3/5)
If your organization runs traditional or hybrid Waterfall projects, having robust support for task dependencies is non-negotiable. This is where the native Jira tools show their major weaknesses!
The Full Control Tier: True Waterfall Logic
The four dedicated third-party apps—BigGantt, Structure + Structure.Gantt, WBS Gantt-Chart for JIRA, and ProScheduler—all offer full Waterfall support.
Crucially, they handle the advanced, Gantt-specific dependencies required for true fixed-schedule management, such as:
Start-to-Start (SS): Task B can only start when Task A starts.
End-to-End (EE): Task B can only finish when Task A finishes.
This precise logic is absolutely essential for complex scheduling and managing project risk.
The Limited Tier: Just the Basics
Both of Atlassian’s native tools, Jira Plans (Advanced Roadmaps) and Jira Timeline, confirmed “Yes, but limited” support.
Their biggest drawback is the lack of these specific advanced dependency types (SS, EE). While they handle the basic Finish-to-Start (FS) links, this key limitation prevents true deterministic, fixed-schedule project management within the native Jira environment.
Conclusion: Any Project Management Office (PMO) that needs full control over precise Waterfall scheduling and dependency logic must invest in one of the dedicated third-party Gantt applications. The native Jira tools simply don’t have the necessary depth for complex, fixed-schedule projects.
Critical path
The Critical Path is the sequence of tasks where any delay directly postpones the entire project completion date. Its visualization allows managers to prioritize efforts and instantly identify the highest-risk areas of the schedule.
Visualizing the Critical Path in Structure.Gantt for Jira. Instantly highlight the sequence of critical tasks and dependencies that govern your project timeline. A must-have for Jira Project Managers seeking to identify bottlenecks and guarantee on-time delivery with precise Critical Path analysis.
Jira Tool
Critical Path (CP) Support Score (Max ⋆⋆⋆)
CP Type
The PMO Reality Check
BigGantt
Basic CP
Offers the standard, must-have CP calculation.
Structure + Structure.Gantt
Basic CP
CP is a standard feature for deterministic planning.
WBS Gantt-Chart for JIRA
Basic CP
Reliable CP support for all Waterfall schedules.
ProScheduler
Basic CP
External app with standard professional CP logic.
Jira Plans (Advanced Roadmaps)
(Critical Fail)
NONE
Does not support Critical Path calculation.
Jira Timeline
(Critical Fail)
NONE
No CP support. Too basic for fixed deadlines.
For any Project Management Office (PMO) managing projects with fixed deadlines (Waterfall or hybrid), the ability to calculate and visualize the Critical Path (CP) is mandatory. This is the sequence of tasks that determines the absolute earliest a project can finish.
Third-Party Apps: CP Is Standard
Good news! If you are using a dedicated third-party Gantt app, you’re covered. BigGantt, Structure + Structure.Gantt, WBS Gantt-Chart for JIRA, and ProScheduler all deliver a basic Critical Path calculation (scoring ⋆⋆⋆).
This means CP is essentially a commoditized feature among the major dedicated Jira Gantt plugins. While none of them typically offer super-advanced techniques (like PERT or Critical Chain), they provide the essential CP visualization you need.
Native Tools: A Critical Failure
Here’s the massive drawback for the native Atlassian solutions: Jira Plans (Advanced Roadmaps) and Jira Timeline both scored a critical ⋆.
They do not support Critical Path functionality at all.
The Conclusion: If your organization needs deterministic scheduling, risk analysis, and clear CP visualization to manage fixed deadlines, you must implement a dedicated third-party Gantt solution. Relying on native Jira tools means you simply cannot perform this fundamental project management function.
Baselines
A Baseline is a snapshot of the approved plan (schedule and costs) at a specific point in time. The ability to create multiple baselines is crucial for measuring variance against original commitments, tracking scope creep, and meeting auditing requirements.
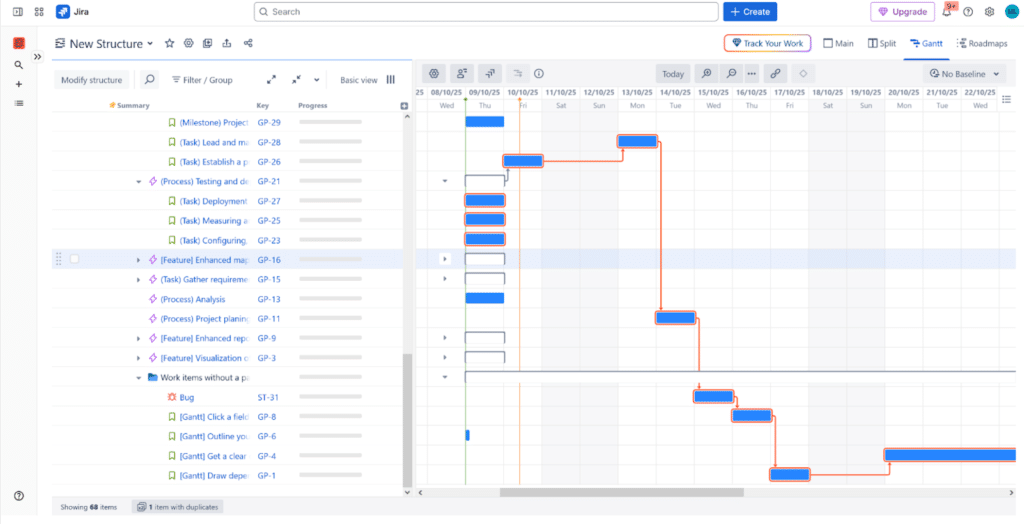
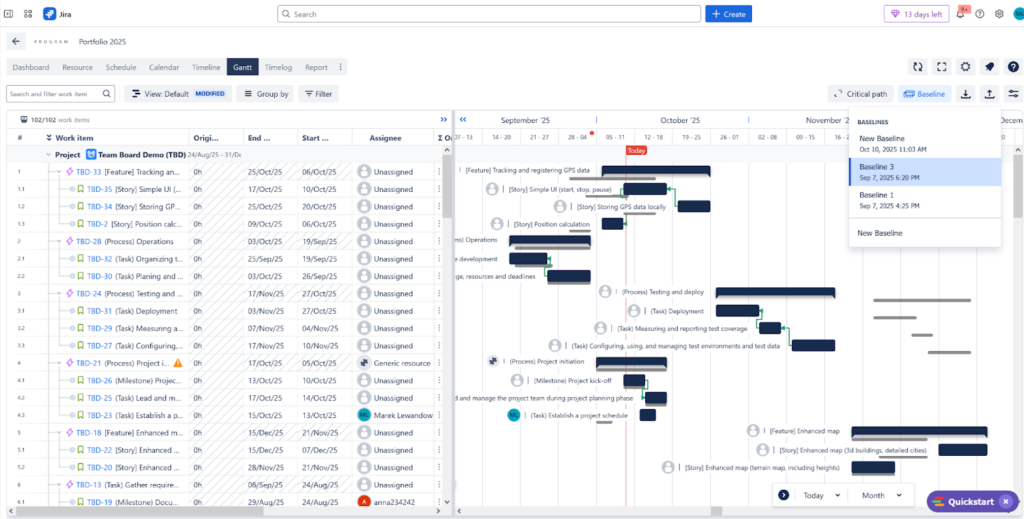
Visualizing the powerful Baselines feature in ProScheduler. This display shows how users can save and compare multiple project baselines against the current schedule. This is essential for Jira Project Management and PMOs to track historical performance, measure schedule variance, and perform in-depth analysis of project deviations.
Jira Tool
Baseline Support Score (Max ⋆⋆⋆⋆⋆)
Baseline Capability
PMO Recommendation
ProScheduler
⭐⭐⭐⭐⭐
(Perfect Score)
Multiple Baselines & Bulk Creation
Best for robust commitment tracking and analysis.
BigGantt
⭐⭐⭐
Single Baseline Only
Good for basic variance tracking.
Structure + Structure.Gantt (CORRECTED)
⭐⭐⭐
Single Baseline Only
Good for basic variance tracking; lack of multi-baseline is a governance limit.
WBS Gantt-Chart for JIRA
⭐⭐⭐
Single Baseline Only
Good for basic variance tracking.
Jira Plans (Advanced Roadmaps)
⭐⭐
(Poor)
NONE on the timeline view
No dedicated baseline tracking for project governance.
Jira Timeline
⭐⭐
(Poor)
NONE
Simply too basic for tracking planned vs. actual.
For a Project Management Office (PMO), creating and managing Baselines is the absolute cornerstone of project governance. A baseline lets you lock in the original plan so you can measure how far the actual delivery deviates from your commitment (variance).
Third-Party Apps: Most Use a Single Baseline
Based on this final correction, most major third-party Gantt apps—BigGantt, Structure + Structure.Gantt, and WBS Gantt-Chart for JIRA—all support a single baseline only (⋆⋆⋆). While this is a critical project management feature, relying on a single baseline limits the ability to track multiple plan changes over time.
The Multi-Baseline Champion: The external ProScheduler is the clear leader with a perfect ⋆⋆⋆⋆⋆ score! It offers robust multiple baselines and handy bulk creation tools, essential for detailed governance and long-term project analysis.
Native Tools: Baseline Blindness
The native Atlassian solutions, Jira Plans (Advanced Roadmaps) and Jira Timeline, both score a poor ⋆⋆. They offer NO dedicated baseline functionality on their timeline views.
The Bottom Line: If you need to lock in a committed plan and measure variance accurately—a core PMO requirement—you must use a dedicated third-party Gantt app, though only ProScheduler appears to offer the full multiple baseline governance feature.
“What-If” Scenarios
“What-If” Scenarios enable managers to test schedule changes (e.g., resource reallocation, task delays) without affecting the live Jira data. This is an invaluable risk management tool for simulating outcomes before committing to a decision.
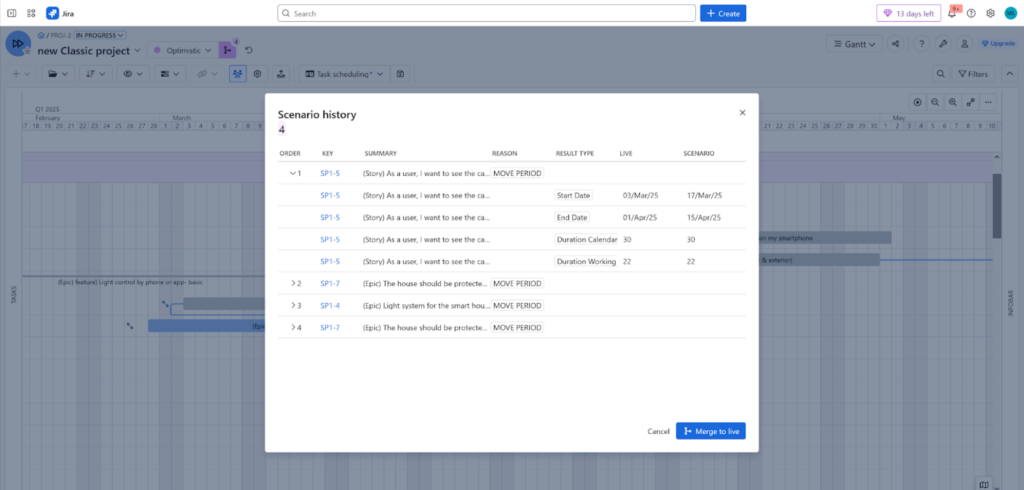
Visualizing the powerful What-If Scenarios feature in BigGantt for Jira. This dedicated mode allows Jira Project Managers to safely model and test schedule changes, resource shifts, and dependencies before committing updates to the live project data, ensuring effective, risk-free Jira roadmapping
Tool
What-If Scenario Support?
Integration Level
The Safety Net Verdict
Safety Rating
BigGantt
YES (Robust)
Scenario mode
Excellent: Safely model changes with a dedicated feature.
⭐⭐⭐⭐ (4/5)
Structure + Structure.Gantt
NO
Integrated Sandbox
Excellent: Experiment with schedule and resource changes safely.
⭐ (1/5)
WBS Gantt-Chart for JIRA
YES (Robust)
Integrated Sandbox
Excellent: Core feature for proactive risk management.
⭐⭐ (2/5)
ProScheduler
YES
Integrated Sandbox
Excellent: External tool with dedicated scenario modeling.
⭐⭐ (2/5)
Jira Plans (Advanced Roadmaps)
YES
Integrated Sandbox
Good: Native Atlassian’s premium feature for safe modeling.
⭐⭐⭐ (3/5)
Jira Timeline
NO
Manual Comparison
Weak: Possible but requires manual work or comparison outside the main view.
⭐ (1/5)
What-If Scenario Planning
Effective project and portfolio management in Jira requires the ability to safely plan for uncertainty. What-If Scenario Planning allows teams to model the impact of changes—such as resource shifts, scope creep, or new initiatives—without affecting the live project data.
The Jira ecosystem offers several powerful tools for this crucial function, primarily categorized into native Atlassian features and robust Marketplace apps.
Isolation is Key: The most effective tools (BigGantt, Advanced Roadmaps, Structure) utilize a Sandbox or Scenario Mode. This feature allows planners to modify dates, resources, and dependencies, then compare the outcomes to the original plan before committing any changes back to Jira.
Resource Modeling: Advanced capabilities are crucial for complex planning. When a new project is added, tools like Advanced Roadmaps and dedicated plugins like Tempo Planner (often mentioned for its superior multi-team resource allocation) are used to visualize and balance team workload conflicts across different scenarios.
Native Limitations: While Jira Plans (Advanced Roadmaps) is the native Atlassian solution, some users find it less flexible for complex scenarios involving intricate resource allocation across multiple, concurrent initiatives or when trying to manage items from Jira Product Discovery at a portfolio level.
The Weakest Link: The basic Jira Timeline feature offers limited “what-if” capability, requiring manual data comparison and offering a weaker safety net compared to the dedicated scenario-enabled applications.
III. Scheduling, Resource Allocation, and Warnings
Dependencies
The heart of the Gantt chart, dependencies (Start-to-Start, Finish-to-Start, etc.) define the necessary sequence of work and ensure logical project flow.
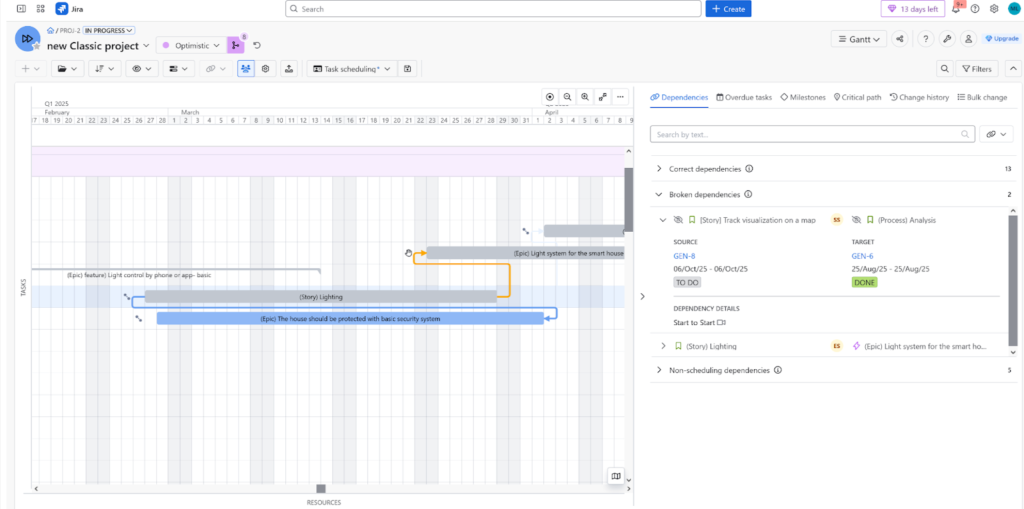
Visualizing dependencies in BigGantt for Jira, featuring clear warnings for broken or conflicting links. This display shows how Jira Project Managers can instantly spot and fix scheduling issues, ensuring project integrity and preventing delays. Use BigGantt’s visual feedback to maintain accurate task sequencing and reliable dependency management.
Jira Tool
Dependency Support Score (Max ⋆⋆⋆⋆⋆)
Advanced Link Types (SS/FF)?
Scheduling Precision Verdict
BigGantt
⭐⭐⭐⭐⭐ (Perfect Score)
YES (Most Flexible & Robust)
The most precise tool for complex scheduling logic.
Structure + Structure.Gantt
⭐⭐⭐⭐⭐
(Perfect Score)
YES (Most Flexible & Robust)
Top-tier flexibility for defining task relationships accurately.
WBS Gantt-Chart for JIRA
⭐⭐⭐
YES (Standard 4 Types)
Supports all essential Gantt link types (FS, SS, FF, SF).
ProScheduler
⭐⭐⭐
YES (Standard 4 Types)
Professional-grade dependency support.
Jira Plans (Advanced Roadmaps)
⭐⭐
(Poor)
NO (Limited to Jira ‘Blocks’)
Severely limited scheduling precision.
Jira Timeline
⭐⭐
(Poor)
NO (Limited to Jira ‘Blocks’)
Only offers basic, non-Gantt dependency logic.
For any Project Management Office (PMO), precise Dependency Linking is a fundamental requirement. You need to accurately define how one task must relate to another (e.g., must they start at the same time? must they finish together?).
The Top Tier: Ultimate Precision
The leading dedicated Jira apps BigGantt and Structure + Structure.Gantt both achieved a perfect ⋆⋆⋆⋆⋆ rating. They offer the most robust and flexible support for creating advanced dependency links, allowing for highly precise and complex scheduling.
WBS Gantt-Chart for JIRA and ProScheduler are strong contenders (⋆⋆⋆), as they support the four standard, critical Gantt link types:
Finish-to-Start (FS)
Start-to-Start (SS)
Finish-to-Finish (FF)
Start-to-Finish (SF)
The Native Tools: Severely Limited
The native Atlassian solutions, Jira Plans (Advanced Roadmaps) and Jira Timeline, both scored a poor ⋆⋆.
Their dependency logic is severely limited to only the basic Jira “Blocks” link type.
The Conclusion: If you require comprehensive, precise, and dependency-driven project scheduling—especially using the critical SS or FF link types—the leading third-party applications like BigGantt and Structure + Structure.Gantt are the only viable choice. The native platform is too basic for professional scheduling needs.
Automatic Task Start/End Date Updates
Also known as auto-scheduling, this feature automatically adjusts task dates and parent summary dates based on dependencies and resource availability. It keeps the plan consistent and accurate without requiring constant manual recalculation.
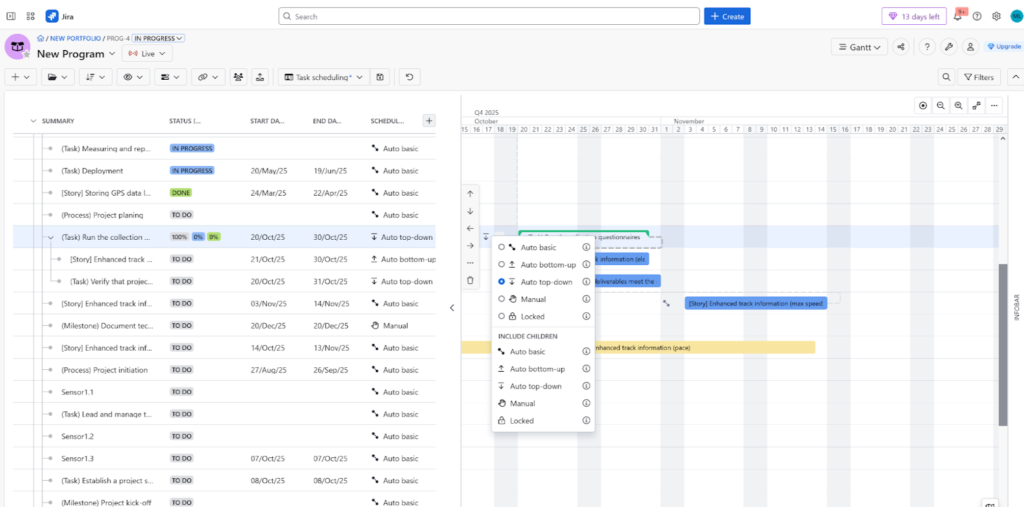
Visualizing BigGantt’s powerful Auto-scheduling feature. This functionality automatically adjusts the project timeline and dependent issues based on 5 different scheduling modes, including Top-Down, Bottom-Up, Locked, and Manual. It’s an indispensable tool for Jira Project Managers to maintain an accurate, up-to-date schedule and ensure all dependencies are correctly calculated for any project methodology.
Jira Tool
Auto-Scheduling Score (Max ⋆⋆⋆⋆⋆)
Scheduling Mode & Flexibility
The Winner for Control
BigGantt
⭐⭐⭐⭐⭐
(Perfect Score)
Advanced, Multi-Mode (Varies by issue type)
CLEAR LEADER: Maximum flexibility and nuanced control.
WBS Gantt-Chart for JIRA
⭐⭐⭐
Manual / Auto per Item (WBS)
Good control: Toggle auto-mode on/off per individual task.
ProScheduler
⭐⭐⭐
Manual / Auto per Project
Good control: Toggle auto-mode on/off for the whole project.
Jira Plans (Advanced Roadmaps)
⭐⭐⭐
Manual / Auto, Sprint-Based
Adequate: Auto-mode is tied to Agile sprints.
Structure + Structure.Gantt
⭐⭐⭐
Basic Auto-Scheduling
Adequate: Core functionality for date adjustments.
Jira Timeline
⭐⭐ (Lowest)
Manual / Auto, Sprint-Based
Limited: Least flexible for non-Agile (Waterfall) planning.
Auto-Scheduling is crucial for effective project management—it’s the feature that automatically shifts task dates when durations or dependencies change. But not all auto-scheduling is created equal!
The Clear Leader: Advanced, Nuanced Control
BigGantt stands out with a perfect ⋆⋆⋆⋆⋆ rating. It offers the most sophisticated and nuanced control, including multiple scheduling options and the unique ability to vary the scheduling mode based on the issue type. This provides maximum project flexibility, making it the superior tool for organizations requiring high-level control.
The Mid-Tier: Good, Targeted Control
The majority of apps cluster around a solid ⋆⋆⋆:
WBS Gantt-Chart for JIRA is great because you can toggle the auto/manual mode on a per-item (WBS) basis.
ProScheduler allows the toggle on a per-project basis.
Jira Plans (Advanced Roadmaps) and Structure + Structure.Gantt offer basic to adequate auto-scheduling functionality.
The Most Limited
Jira Timeline gets the lowest score (⋆⋆). While it has a Manual/Auto mode, it’s heavily sprint-based, making it the least flexible option for traditional or hybrid (waterfall) planning needs.
In Summary: For organizations that need the most sophisticated and nuanced scheduling control over complex projects, BigGantt is the clearly superior tool.
Resources & Non-user Resources
Planning is about people and capacity. Effective Resource Management (including teams, individuals, and capacity planning) prevents burnout and endures balanced workload allocation. Non-user resources (eg. equipment, licences) are vital for including all contraints in the overal plan.
Visualizing TeamBoard ProScheduler’s comprehensive Resource Management dashboard. The display highlights color-coded workload views, instantly showing overloaded, balanced, and underutilized team members. Jira Project Managers can leverage the Schedule Board to use drag-and-drop allocation, set custom team capacity, and factor in time off and holidays to ensure optimal, cross-project resource distribution.
Jira Tool
Resource Management Score (Max ⋆⋆⋆⋆⋆)
Capacity Planning Features
Key Limitation
ProScheduler
⭐⭐⭐⭐
(Strongest)
Supports Teams, Generic Resources, and Grouping.
Lacks Automated Leveling.
Jira Plans (Advanced Roadmaps)
⭐⭐⭐
Dedicated Capacity View.
Lacks Automated Leveling.
Structure + Structure.Gantt
⭐⭐⭐⭐
(Strongest)
Supports individuals and basic views. Available auto-leveling.
No Team Support.
WBS Gantt-Chart for JIRA
⭐⭐⭐
Supports duration effort adjustment.
No Team Support or Leveling.
BigGantt
⭐⭐
(Limited)
Limited to Individual Users.
No Team Support or Leveling.
Jira Timeline
⭐⭐
(Limited)
No direct Resource View on the timeline.
Lacks Dedicated Resource Features.
For identifying over-allocation and ensuring project feasibility, robust Resource Management and Capacity Planning is critical. Our analysis shows solid, but often limited, support across the board, with one major missing piece: automated resource leveling.
Resource Management: Defining the Pool
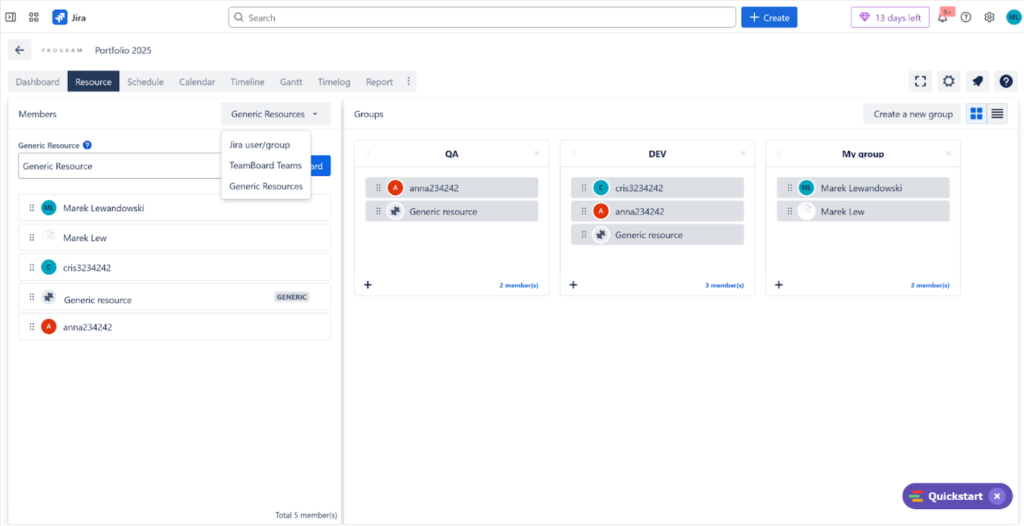
Visualizing TeamBoard ProScheduler’s Generic Resources feature. This allows Jira Project Managers to plan for non-user resources like equipment or placeholder roles during early project phases. Tasks are assigned to Generic Resources, tracked for capacity, and easily reassigned to actual users later, ensuring comprehensive resource planning.
ProScheduler emerges as the strongest offering (⋆⋆⋆⋆). It is the most comprehensive, supporting teams, generic resources, and advanced grouping (like departments) for defining a complete resource pool.
Jira Plans (Advanced Roadmaps) (⋆⋆⋆) also performs well by offering a dedicated capacity view to visualize workload. Structure + Structure.Gantt and WBS Gantt-Chart for JIRA also score a moderate ⋆⋆⋆, though WBS is notably limited as it supports neither teams nor leveling.
BigGantt and Jira Timeline lag with ⋆⋆ scores. BigGantt is limited to only tracking individuals, and the native Jira Timeline simply doesn’t support resource views directly on the timeline.
Jira Tool
Generic Resource Support Score (Max ⋆⋆⋆⋆⋆)
Capability
The Problem
ProScheduler
⭐⭐⭐⭐
(Strongest)
Explicitly supports Generic/Non-User Resources.
Clear leader for tracking equipment or generic roles.
Structure + Structure.Gantt
⭐⭐⭐
Limited, non-user-friendly support.
Requires workarounds to track non-human resources.
BigGantt
⭐⭐
Tracking is only based on Jira user accounts.
Cannot track equipment or generic roles easily.
WBS Gantt-Chart for JIRA
⭐ (No Support)
No support for Non-User Resources.
Cannot assign tasks to equipment or generic roles.
Jira Plans (Advanced Roadmaps)
⭐(No Support)
No support for Non-User Resources.
Cannot assign tasks to equipment or generic roles.
Jira Timeline
⭐ (No Support)
No support for Non-User Resources.
Cannot assign tasks to equipment or generic roles.
The ability to track Non-User or Generic Resources (like testing equipment, conference rooms, or generic roles like “QA Specialist”) is highly inconsistent:
ProScheduler is the clear winner (⋆⋆⋆⋆), offering explicit support for Generic Resources.
Structure + Structure.Gantt provides only limited, non-user-friendly support (⋆⋆⋆).
BigGantt is very basic (⋆⋆), relying only on existing Jira user accounts.
Crucially, WBS Gantt-Chart for JIRA, Jira Plans, and Jira Timeline all offer NO support for non-user resources (⋆).
Overall Conclusion: While ProScheduler provides the best resource definition features, the most desirable high-end capability—automated resource leveling—is absent across the entire spectrum of Jira Gantt solutions.
Warninigs
Automated alerts for breaches like broken dependencies, parent-child scheduling conflicts, or overdue tasks act as a project’s erarly warning system. The allow managers to address the issues early , reducing the risks of delays and prevent small problems from escalating into major issues.
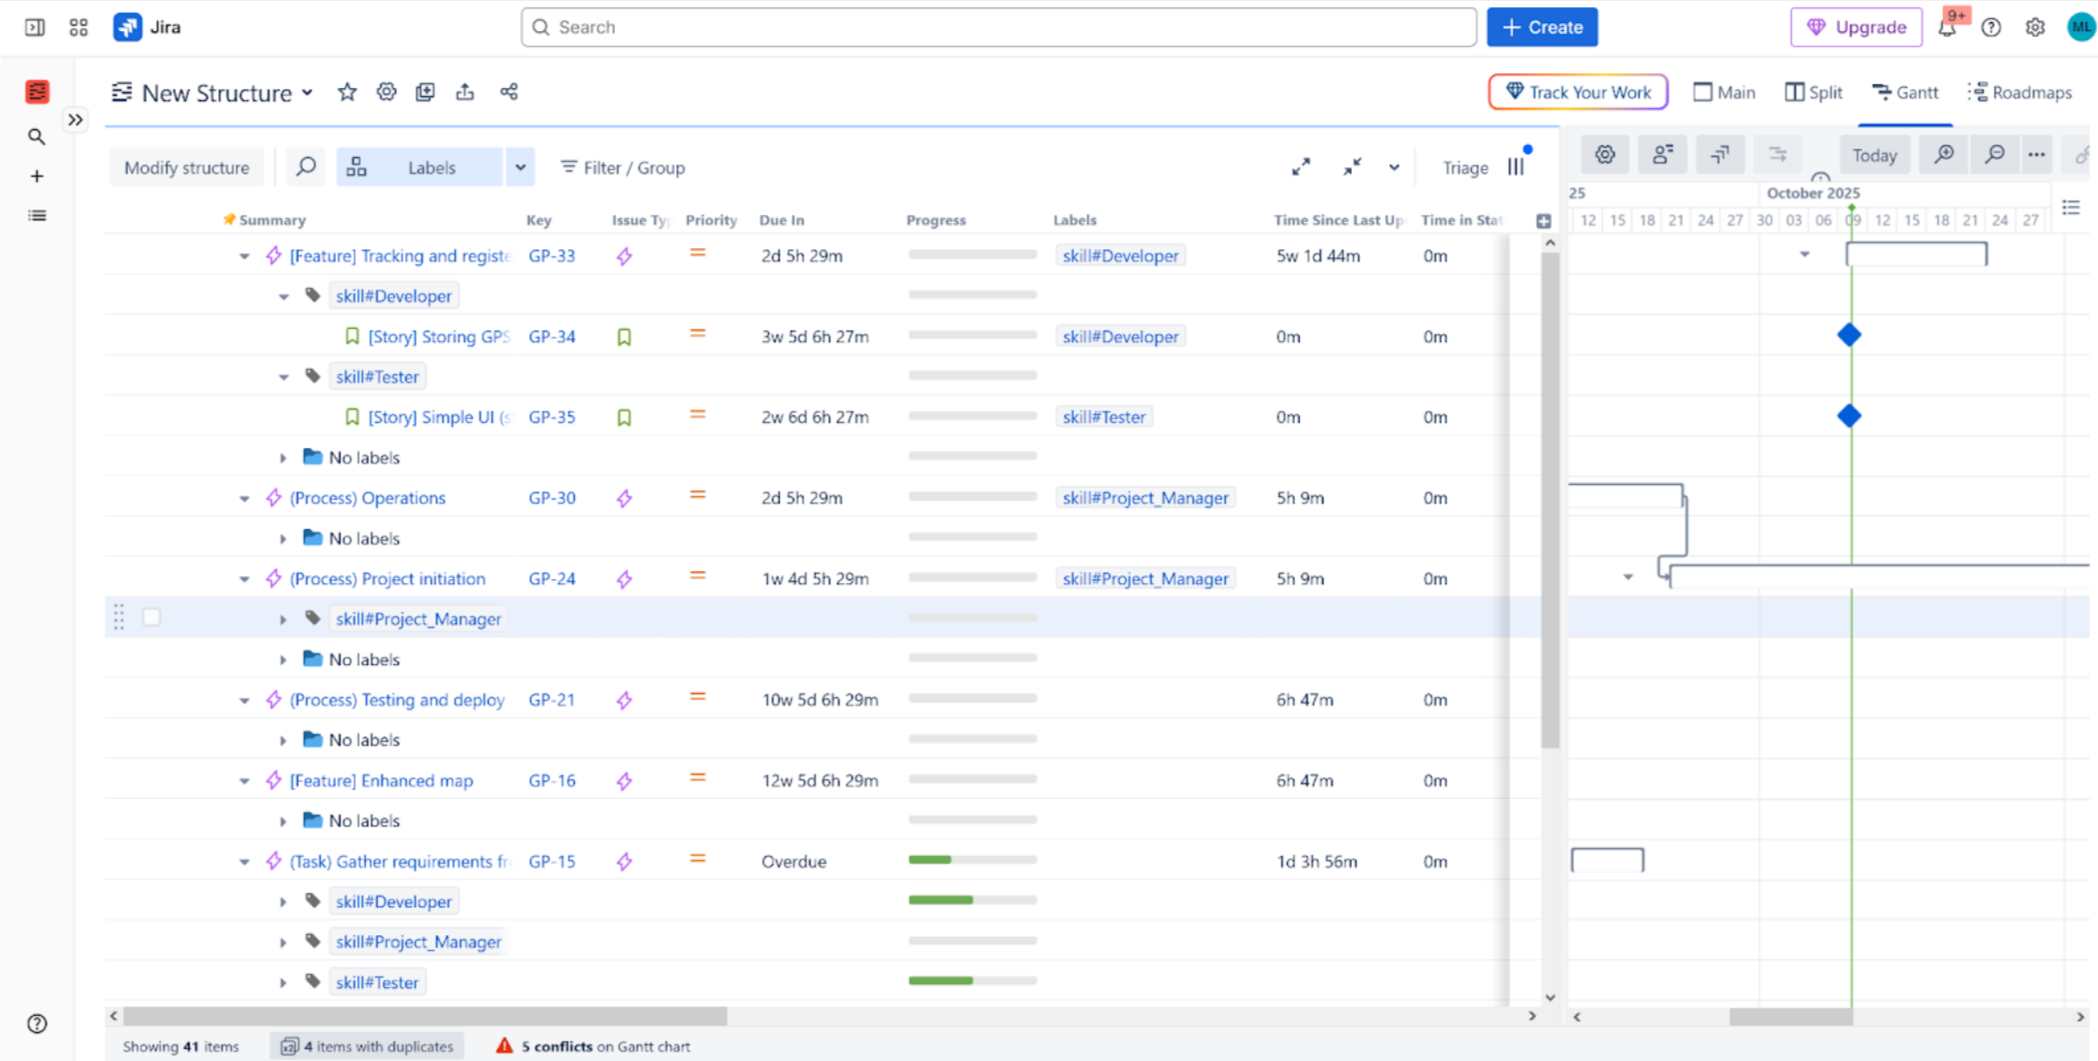
A Structure for Jira Formula Column that visually flags Scheduling Conflicts and WBS Warnings. This calculated field leverages the Gantt Scheduling Error attribute from Structure.Gantt to display an explicit ‘Error’ status or apply Conditional Formatting (e.g., red background/icon) using Wiki Markup. Ideal for Project Managers to quickly identify tasks with off-track dependencies, date conflicts, or resource overallocation within the hierarchical Jira Structure view, ensuring real-time schedule compliance.
Jira Tool
Warning System Score (Max ⋆⋆⋆⋆⋆)
Key Risk Indicators
PMO Advantage
Structure + Structure.Gantt
(Perfect Score)
Calculated Fields, Color-Coded Warnings
Deepest Customization: Build any risk indicator you need.
Good Native Support: More advanced than basic Jira.
WBS Gantt-Chart for JIRA
(Basic)
Basic Alerts (Status, Date).
Adequate: Simple, customizable alerts.
ProScheduler
(Basic)
Basic Alerts (Status, Date).
Adequate: Simple, customizable alerts.
Jira Timeline
(Lowest)
Basic Warnings Only.
Limited: Little help with proactive risk anticipation.
The flexibility to create Custom Formulas and Data Aggregations is a highly valuable capability for Project Management Offices (PMOs). It lets you generate custom, advanced metrics like weighted priority scores, financial roll-ups, or custom risk indices directly within your planning tool.
The Undisputed Champion: Excel-Like Power
In this feature category, Structure + Structure.Gantt stands as the clear and undisputed market leader, achieving a perfect ⋆⋆⋆⋆⋆ rating.
Its core strength is its ability to support robust, Excel-like formulas. This is a significant differentiator that transforms it into a powerful, dynamic reporting engine—not just a planning tool.
The Rest: Limited to Basic Roll-ups
By comparison, the remaining five solutions all score low:
BigGantt received a ⋆⋆⋆, indicating some level of simple aggregation support, but it lacks the functionality for true custom, user-defined calculations.
Crucially, WBS Gantt-Chart for JIRA, ProScheduler, Jira Plans (Advanced Roadmaps), and Jira Timeline all scored a low ⋆⋆. Their aggregation features are severely limited to basic date and status roll-ups.
The Conclusion: If your PMO requires advanced, user-defined metrics, financial roll-ups, or custom calculations to guide strategic decisions, Structure is the necessary and only viable tool in the Jira ecosystem.
Reports
While Formulas offer flexibility, dedicated reporting modules provide structured dashboards for leadership, offering standardized views (e.g., health status, portfolio overview) that are easy for stakeholders to consume.
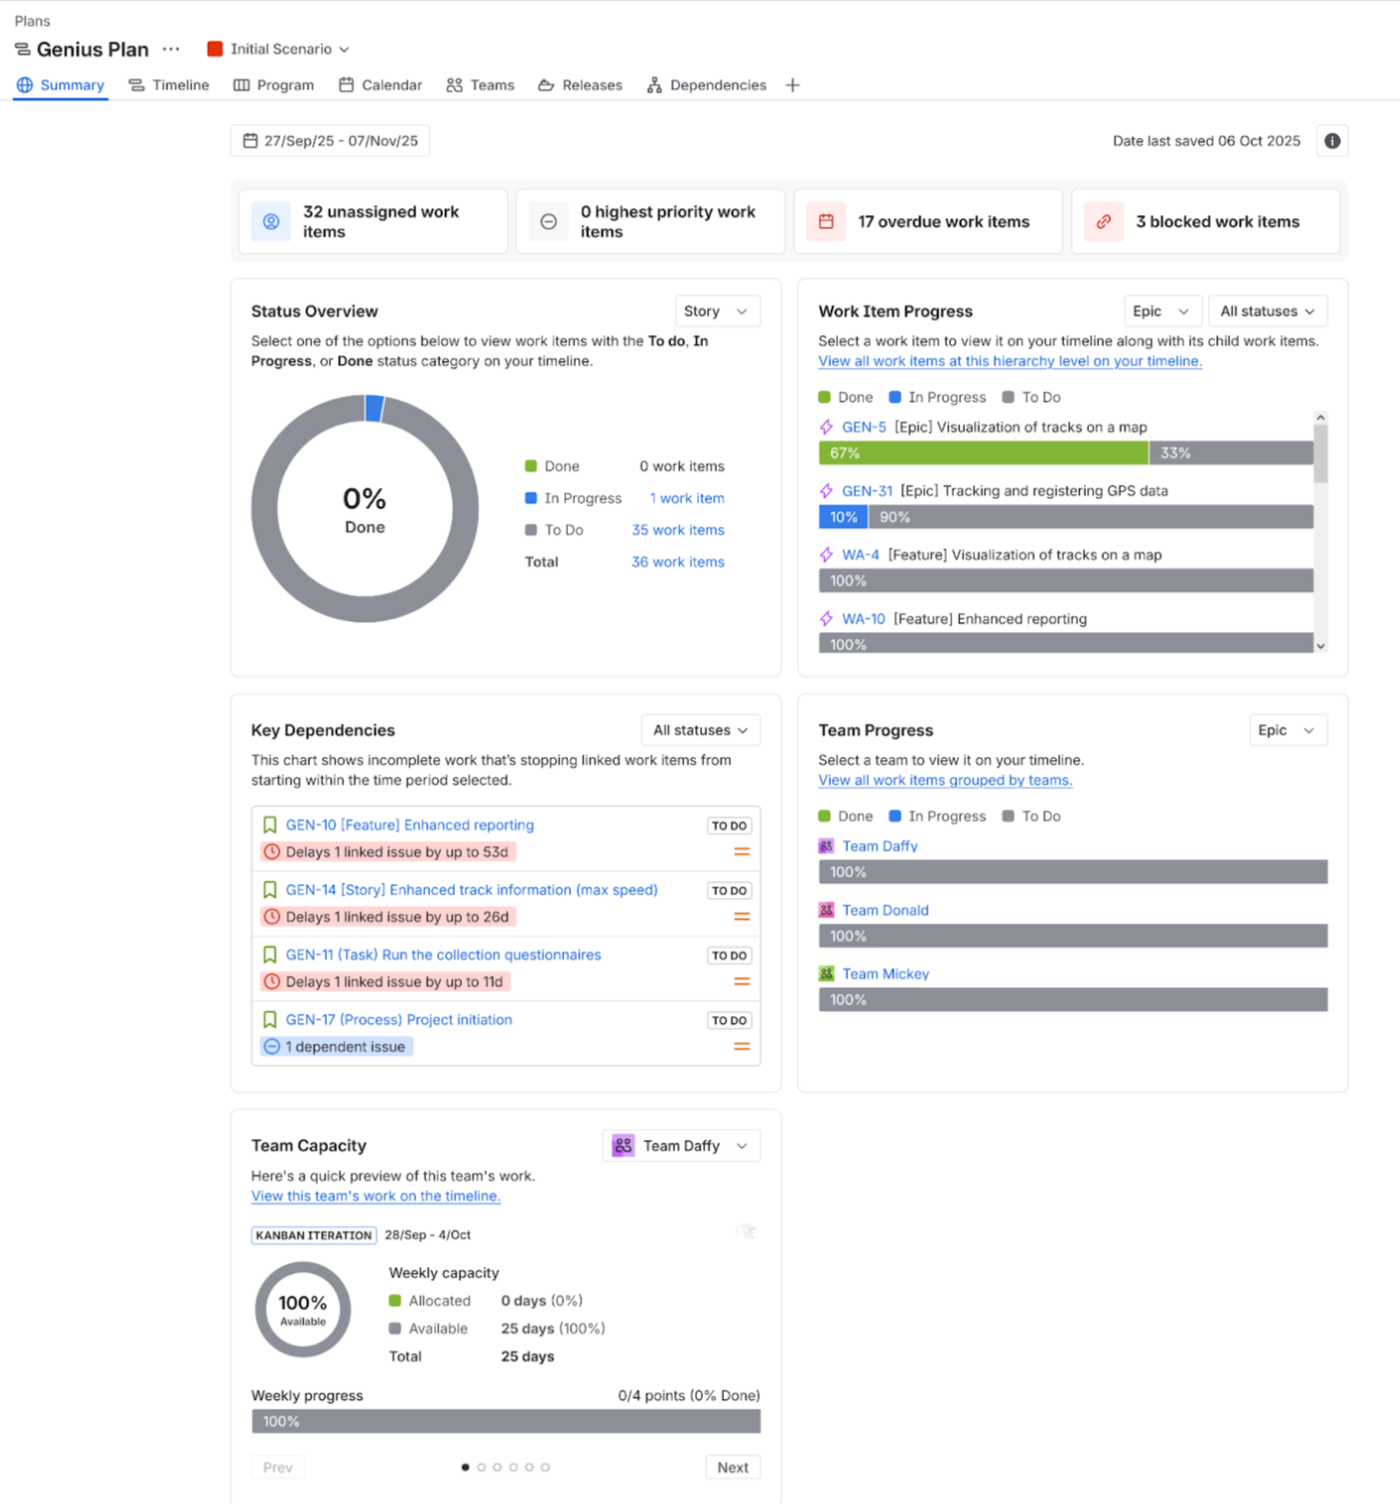
Screenshot of the Jira Plans Summary dashboard (Advanced Roadmaps), optimized for high-level portfolio reporting. Key widgets display aggregated metrics for Unassigned, Overdue, and Blocked Work Items, alongside visual breakdowns of Status Overview, Team Capacity, and the most critical Key Dependencies (e.g., overdue blockers). Essential for Project Portfolio Management and gaining real-time program health insights.
Jira Tool
Reporting & Financials Score (Max ⋆⋆⋆⋆⋆)
Reporting Strength
Key Limitation
Jira Plans (Advanced Roadmaps)
⭐⭐⭐(Basic)
Dedicated capacity and scenario views.
Dashboards are not highly customizable.
Jira Timeline
⭐⭐⭐(Basic)
Basic reporting on schedule and progress.
Few roll-up or aggregation capabilities.
ProScheduler
⭐⭐⭐(Basic)
Good export features and project overviews.
Few roll-up or aggregation capabilities.
WBS Gantt-Chart for JIRA
⭐⭐⭐(Basic)
Decent structural reporting.
Few roll-up or aggregation capabilities.
Structure + Structure.Gantt
⭐⭐⭐
Excel-like Formulas for Internal Reports.
Relies on external BI for complex executive dashboards.
BigGantt
⭐⭐ (Lowest)
Relies on simple column definition for data.
Lacks Dedicated Reporting Features.
The capacity of a Project Portfolio Management (PPM) tool to generate robust reports, custom financial calculations, and executive dashboards is critical for making informed decisions. Our analysis found that this is a challenging area for nearly all Jira tools.
The Mid-Tier: Formula Power vs. Basic Reporting
Most tools cluster in the ⋆⋆⋆ range, but for different reasons:
Structure + Structure.Gantt gets its ⋆⋆⋆ by allowing users to create Excel-like formulas. This is fantastic for generating effective internal metrics and financial roll-ups (like calculating weighted scores) directly within the tool.
The native Atlassian offerings (Jira Plans and Jira Timeline), ProScheduler, and WBS Gantt-Chart for JIRA also score ⋆⋆⋆ but are limited by their non-customizable dashboards and few roll-up capabilities.
The Lowest Score: Lacks Dedicated Reporting
BigGantt fell short at ⋆⋆. It lacks dedicated reporting features, relying instead on simply defining columns to view data—making executive reporting a manual process.
The Conclusion: While tools like Structure are excellent for creating complex internal data and custom formulas, the overall capability of all these tools is limited. For complex financial reporting, highly customized executive dashboards, or deep business intelligence, you’ll still need to integrate with specialized BI platforms like Power BI or eazyBI.
Adding Columns & Issue Search/Filtering
High configurability allows users to personalize their data view quickly. Advanced filtering options and saved views are essential for efficient daily task management and analysis.
Structure App for Jira lets you apply powerful filters and add custom columns, including dynamic Formula Columns (like calculated progress or risk scores), to transform flat data into actionable, hierarchical reports.
Jira Tool
Data Customization/Formulas (Max ⋆⋆⋆⋆⋆)
Search & Filtering Score (Max ⋆⋆⋆⋆⋆)
Best For PMO Needs
Structure + Structure.Gantt
⭐⭐⭐⭐⭐
(Gold Standard)
⭐⭐⭐⭐
(Excellent)
Custom Metrics & Calculations.
BigGantt
⭐⭐⭐⭐
(Very Strong)
⭐⭐⭐⭐⭐
(Clear Leader)
Fast, Flexible View Tailoring & Filtering.
WBS Gantt-Chart for JIRA
⭐⭐⭐
⭐⭐⭐
Adequate for basic customization and searching.
ProScheduler
⭐⭐⭐
⭐⭐⭐
Adequate for basic customization and searching.
Jira Plans (Advanced Roadmaps)
⭐⭐⭐
⭐⭐⭐
Adequate native filtering.
Jira Timeline
⭐⭐
(Lowest)
⭐⭐
(Lowest)
Very limited control over data and views.
The flexibility of a Project Portfolio Management (PPM) tool to control how data is displayed and accessed is paramount for effective stakeholder communication. This analysis reveals a clear split dominance between the two market leaders, Structure and BigGantt.
1. Data Customization and Roll-up Columns
For Data Customization and Roll-up Columns, Structure + Structure.Gantt established itself as the gold standard with a perfect ⋆⋆⋆⋆⋆ rating. Its key unique power is the capability to add new calculated columns based on user-defined, Excel-like formulas. This custom reporting power is not matched by its closest rival, BigGantt (⋆⋆⋆⋆), which only supports standard aggregate operations like Sum/Average.
2. Search and Filtering
In the realm of Search and Filtering, BigGantt takes the lead with a ⋆⋆⋆⋆⋆ score. It provides the most advanced and flexible user experience, especially through quick filter customization for rapidly tailoring views for different stakeholders. Structure + Structure.Gantt is close behind at ⋆⋆⋆⋆, also offering excellent filtering.
The PMO Bottom Line
The remaining tools (WBS Gantt-Chart for Jira, ProScheduler, and Jira Plans) generally settled into the ⋆⋆⋆ range for both capabilities, with the native Jira Timeline consistently lagging with ⋆⋆.
The final choice depends entirely on your priority:
Organizations prioritizing advanced, custom formula-based reporting and metrics should favor Structure.
Those requiring the most rapid and flexible tailoring of portfolio views via filtering should opt for BigGantt.
In-line Editing
The ability to quickly modify fields (dates, statuses, estimates) directly within the table view, without opening the full Jira issue screen, significantly boosts manager productivity.
Leverage powerful inline editing directly within the Gantt view to instantly update task names, start/end dates, and statuses. This feature eliminates context-switching, making project updates faster and more efficient for real-time planning and dynamic schedule adjustments.
Jira Tool
Inline Editing Score (Max ⋆⋆⋆⋆⋆)
Support Level
The PMO Takeaway
BigGantt
⭐⭐⭐⭐
(High)
Excellent Support (Some fields locked)
Very fast data entry right in the planning view.
Structure + Structure.Gantt
⭐⭐⭐⭐
(High)
Excellent Support (Some fields locked)
Very fast data entry right in the planning view.
WBS Gantt-Chart for JIRA
⭐⭐⭐
(Strong)
Most fields are editable.
Solid: Allows rapid modification of key fields.
ProScheduler
⭐⭐⭐
(Strong)
Most fields are editable.
Solid: Allows rapid modification of key fields.
Jira Plans (Advanced Roadmaps)
⭐⭐⭐
(Strong)
Most fields are editable.
Solid native support for quick updates.
Jira Timeline
⭐⭐⭐
(Strong)
Most fields are editable.
Solid native support for quick updates.
Inline Editing—the ability to change key issue fields (like dates, assignees, or estimates) directly within the planning view—is a core component of efficient project management. It saves time by eliminating the need to open every Jira issue individually.
High Performance Across the Board
In this category, all solutions demonstrated high, consistent performance. Unlike many other features, the convenience of rapid data entry is a well-developed and standardized feature across the entire Jira planning ecosystem.
The Leaders:BigGantt and Structure + Structure.Gantt led the category with strong ⋆⋆⋆⋆ ratings. Both offer excellent support, though they note that a few sensitive or calculated fields may be locked (not inline editable).
Strong Contenders: The remaining four solutions—WBS Gantt-Chart for Jira, ProScheduler, Jira Plans (Advanced Roadmaps), and Jira Timeline—all achieved high ⋆⋆⋆ or ⋆⋆⋆⋆ scores, with a consensus that most key fields are possible to inline edit.
The Conclusion: When looking for a tool that supports rapid data entry and modification, you can be confident that nearly every dedicated and native Jira planning tool will meet this core usability requirement. This is not a major differentiator among the top solutions.
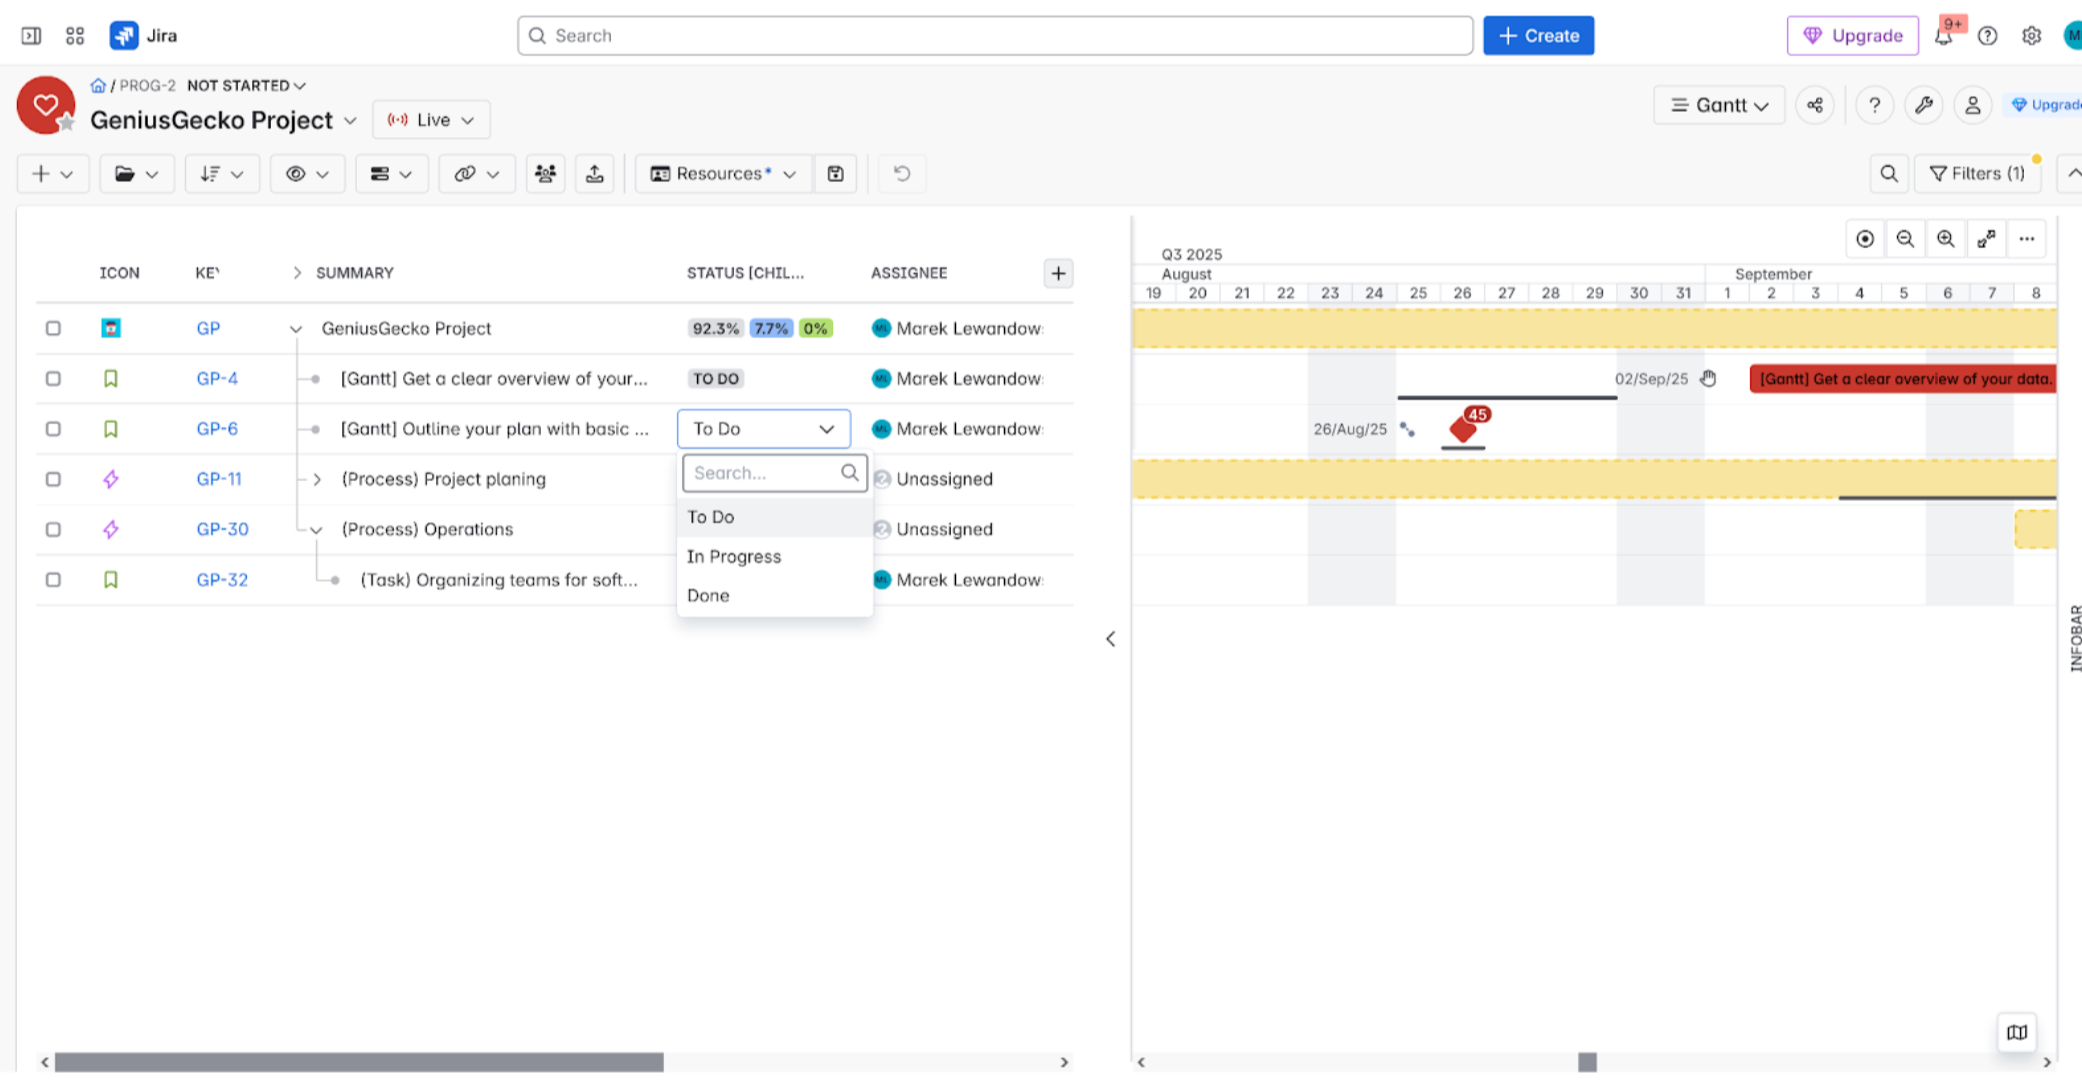
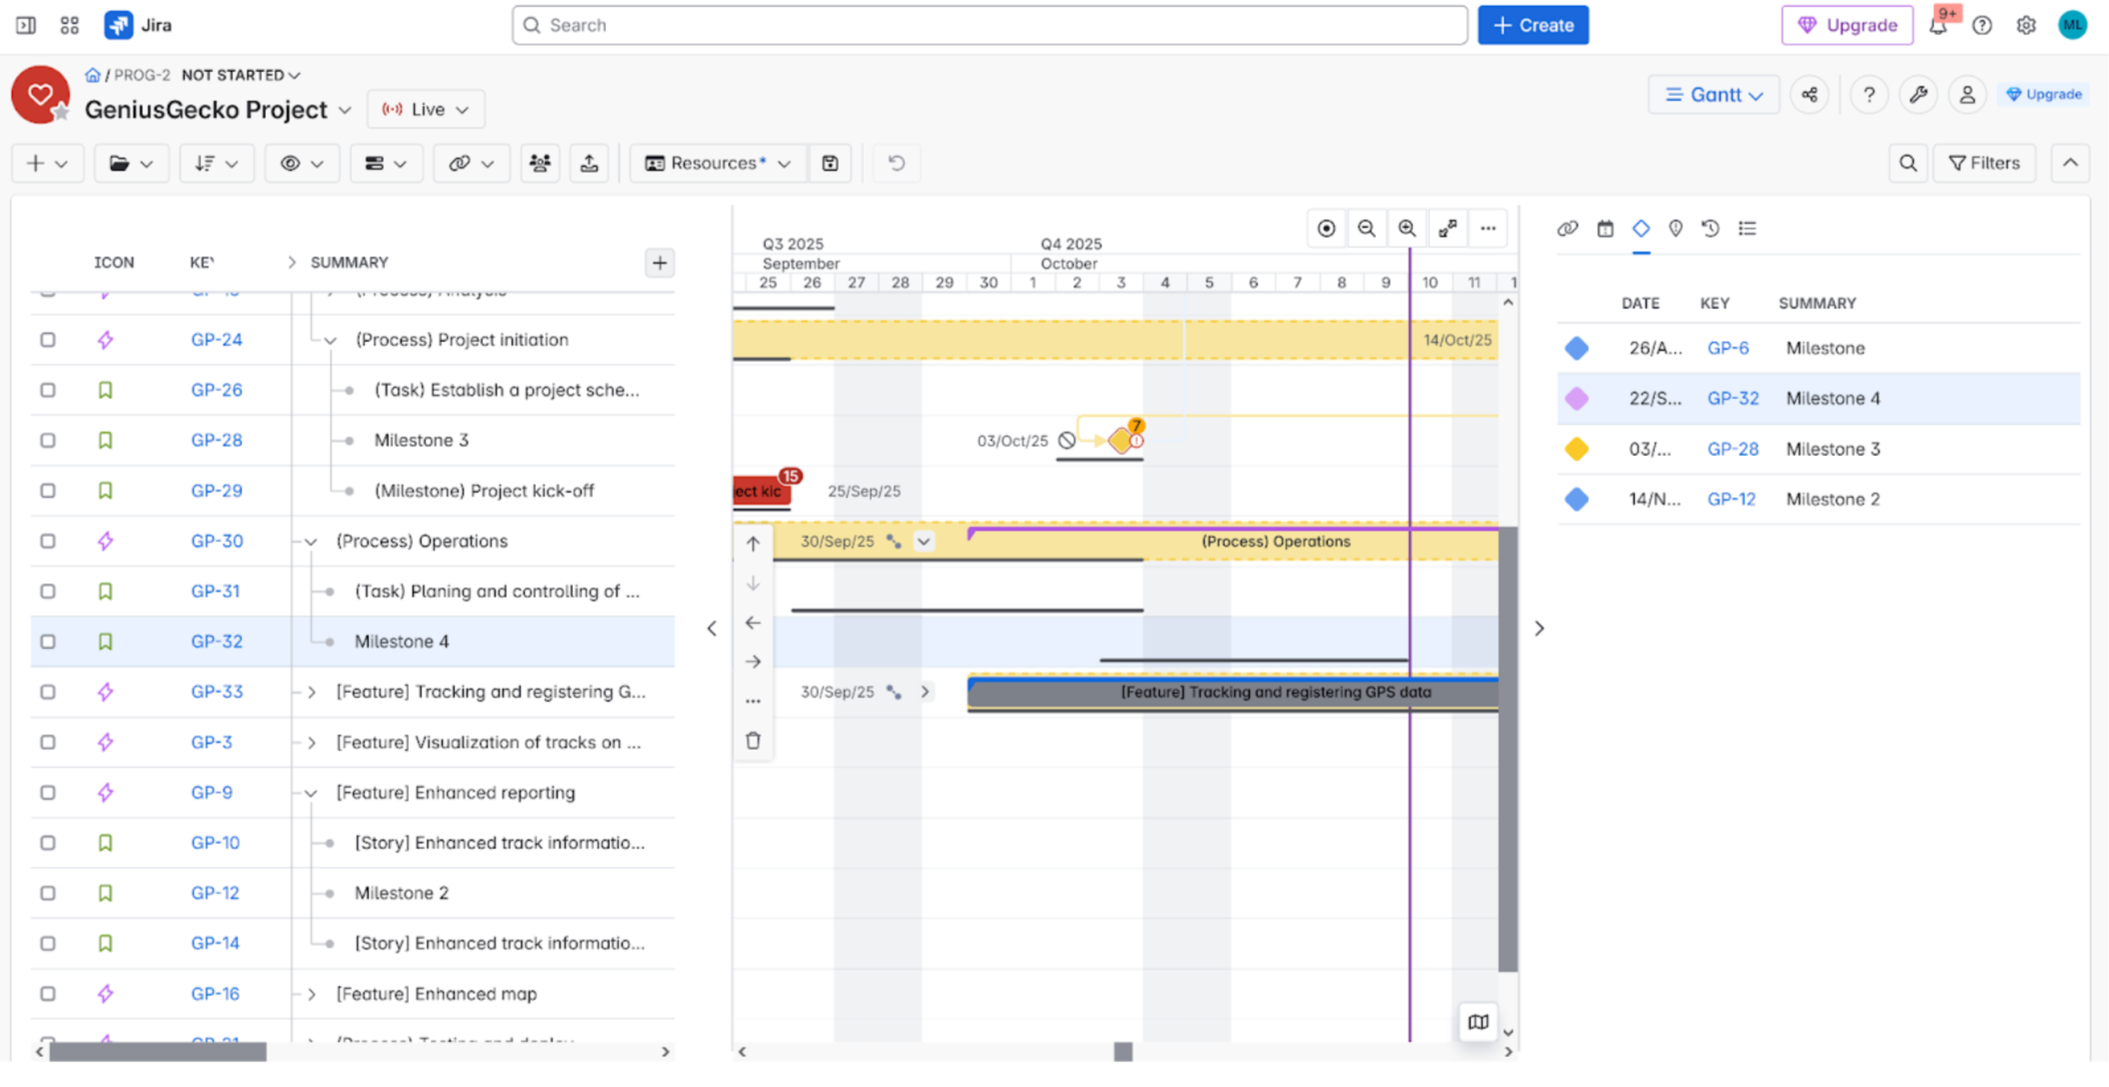
Milestones
Milestones are crucial communication checkpoints. They allow the PMO to track whether the project is meeting its key delivery stages on time.
Visually track and highlight major project deliverables and phase gates directly on your timeline. Define, track, and share key project milestones to ensure stakeholder alignment and drive successful Waterfall and hybrid project delivery
Jira Tool
Milestone Score (Max ⋆⋆⋆⋆⋆)
Milestone Feature
PMO Requirement Check
BigGantt
⭐⭐⭐⭐⭐
(Leader)
Dedicated visual markers & Milestone List (Infobar).
Excellent: Offers dedicated tracking and visibility.
Structure + Structure.Gantt
⭐⭐⭐⭐
Dedicated visual markers on the timeline.
Excellent: Core feature for event tracking.
WBS Gantt-Chart for JIRA
⭐⭐⭐⭐
Dedicated visual markers on the timeline.
Excellent: Core feature for event tracking.
ProScheduler
⭐⭐⭐⭐
Dedicated visual markers on the timeline.
Excellent: Core feature for event tracking.
Jira Plans (Advanced Roadmaps)
⭐(Critical Fail)
NONE
NOT Supported: Cannot track formalized milestones.
Jira Timeline
⭐(Critical Fail)
NONE
NOT Supported: Cannot track formalized milestones.
Milestone Management—the ability to define, track, and communicate key project achievements—is essential for communicating project progress to stakeholders. This feature shows a critical division between the dedicated Gantt tools and the native Atlassian solutions.
The App Ecosystem: Core Competency
Dedicated apps like BigGantt, Structure + Structure.Gantt, WBS Gantt-Chart for Jira, and ProScheduler all scored high (⋆⋆⋆⋆ to ⋆⋆⋆⋆⋆). This confirms that visualizing and tracking major events on the timeline is a core competency for all premium Gantt plugins.
BigGantt edged out the others (⋆⋆⋆⋆⋆), offering great visualization plus a useful dedicated milestone list in its Infobar.
The Native Tools: Complete Absence
Conversely, the native Jira features, Jira Plans and Jira Timeline, both scored a critical ⋆ due to the complete absence of dedicated milestone functionality.
The Conclusion: If your Project Management Office (PMO) requires clear, formalized milestone tracking to manage deadlines and communicate achievements, relying on the native Jira tools is not an option. Implementing one of the premium Jira third-party apps is non-negotiable.
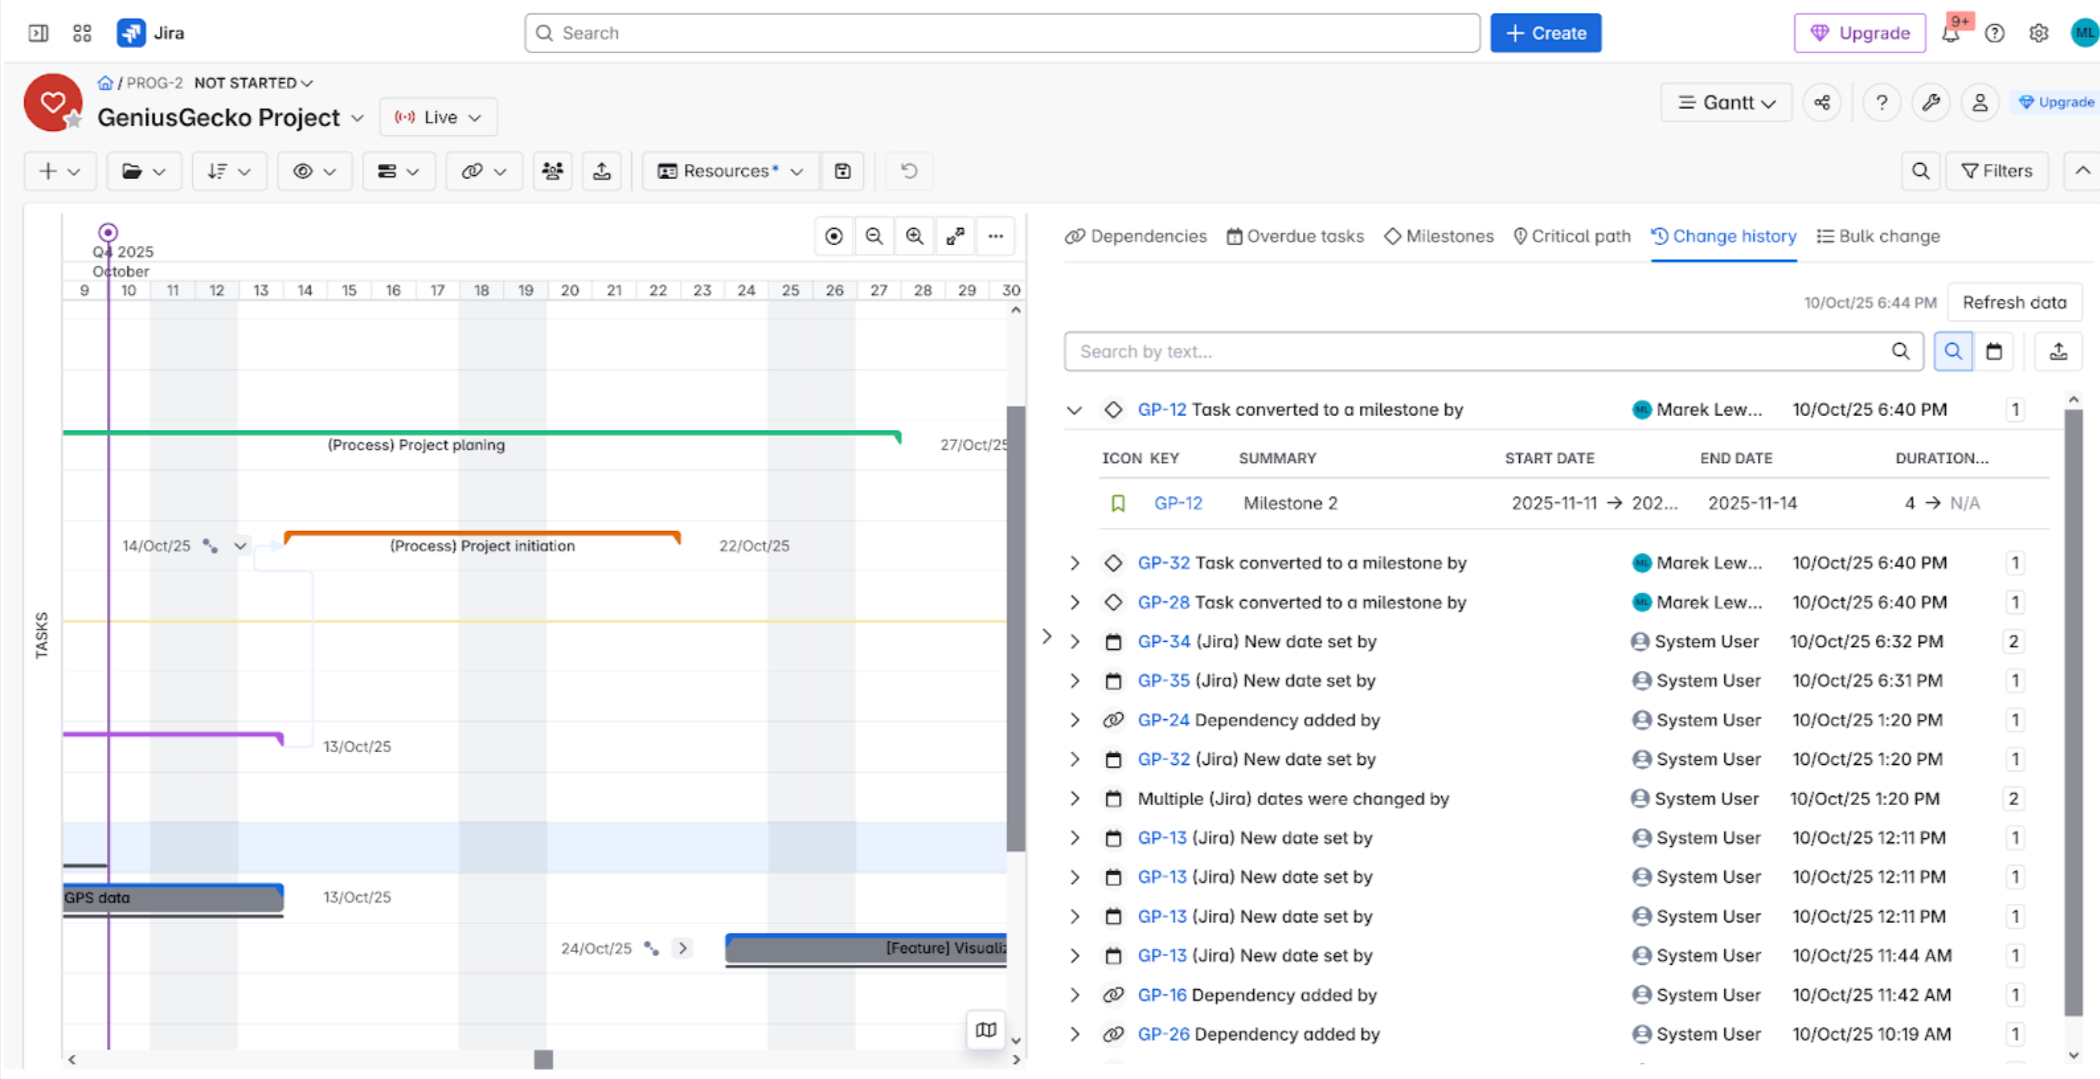
Change History
Tracking changes (e.g., date shifts) helps with project transparency and accountability. It is vital for understanding why and when a project went off track.
Track accountability and project shifts with BigGantt Change History. Review a detailed log of every modification made to your Gantt chart’s schedule, including who made the change and when. This feature ensures full auditability and visibility into project evolution, which is crucial for change management and stakeholder transparency.
Jira Tool
Change History/Auditing Score (Max ⋆⋆⋆⋆⋆)
Auditing Feature
Critical Governance Gap
BigGantt
⭐⭐⭐⭐
(The Exception)
Internal Change History (Limited to 2 weeks/90 entries).
Only dedicated solution for tracking plan changes.
Structure + Structure.Gantt
⭐⭐ (Lowest)
Relies on Native Jira Issue History.
Cannot audit changes to dependencies or the schedule itself.
WBS Gantt-Chart for JIRA
⭐⭐ (Lowest)
Relies on Native Jira Issue History.
Cannot audit changes to dependencies or the schedule itself.
ProScheduler
⭐⭐ (Lowest)
Relies on Native Jira Issue History.
Cannot audit changes to dependencies or the schedule itself.
Jira Plans (Advanced Roadmaps)
⭐⭐ (Lowest)
Relies on Native Jira Issue History.
Cannot audit changes to dependencies or the schedule itself.
Jira Timeline
⭐⭐ (Lowest)
Relies on Native Jira Issue History.
Cannot audit changes to dependencies or the schedule itself.
The requirement for robust Change History and Auditing is absolutely essential for governance and compliance, allowing organizations to track who changed a plan and when. Unfortunately, this analysis highlights a critical governance gap across the entire Jira planning ecosystem.
The Standard Practice: Deferring to Jira
The vast majority of tools—Structure + Structure.Gantt, WBS Gantt-Chart for Jira, ProScheduler, Jira Plans, and Jira Timeline—all scored a low ⋆⋆.
They explicitly defer this responsibility to Jira’s native issue history. This is insufficient for governance because it means:
You can track who changed the due date on an issue.
You cannot easily track who created a dependency, moved a baseline, or adjusted the overall schedule within the planning view.
The Lone Exception
The lone exception was BigGantt, which achieved a ⋆⋆⋆⋆ rating by offering its own internal change history (though it is limited, e.g., to 2 weeks or 90 entries).
The Conclusion: If your Project Management Office (PMO) requires auditing of the plan (the schedule, dependencies, and baselines) separate from the individual issue history, you face a critical gap. You must either utilize the premium BigGantt functionality or implement specialized external data logging and Business Intelligence (BI) tools.
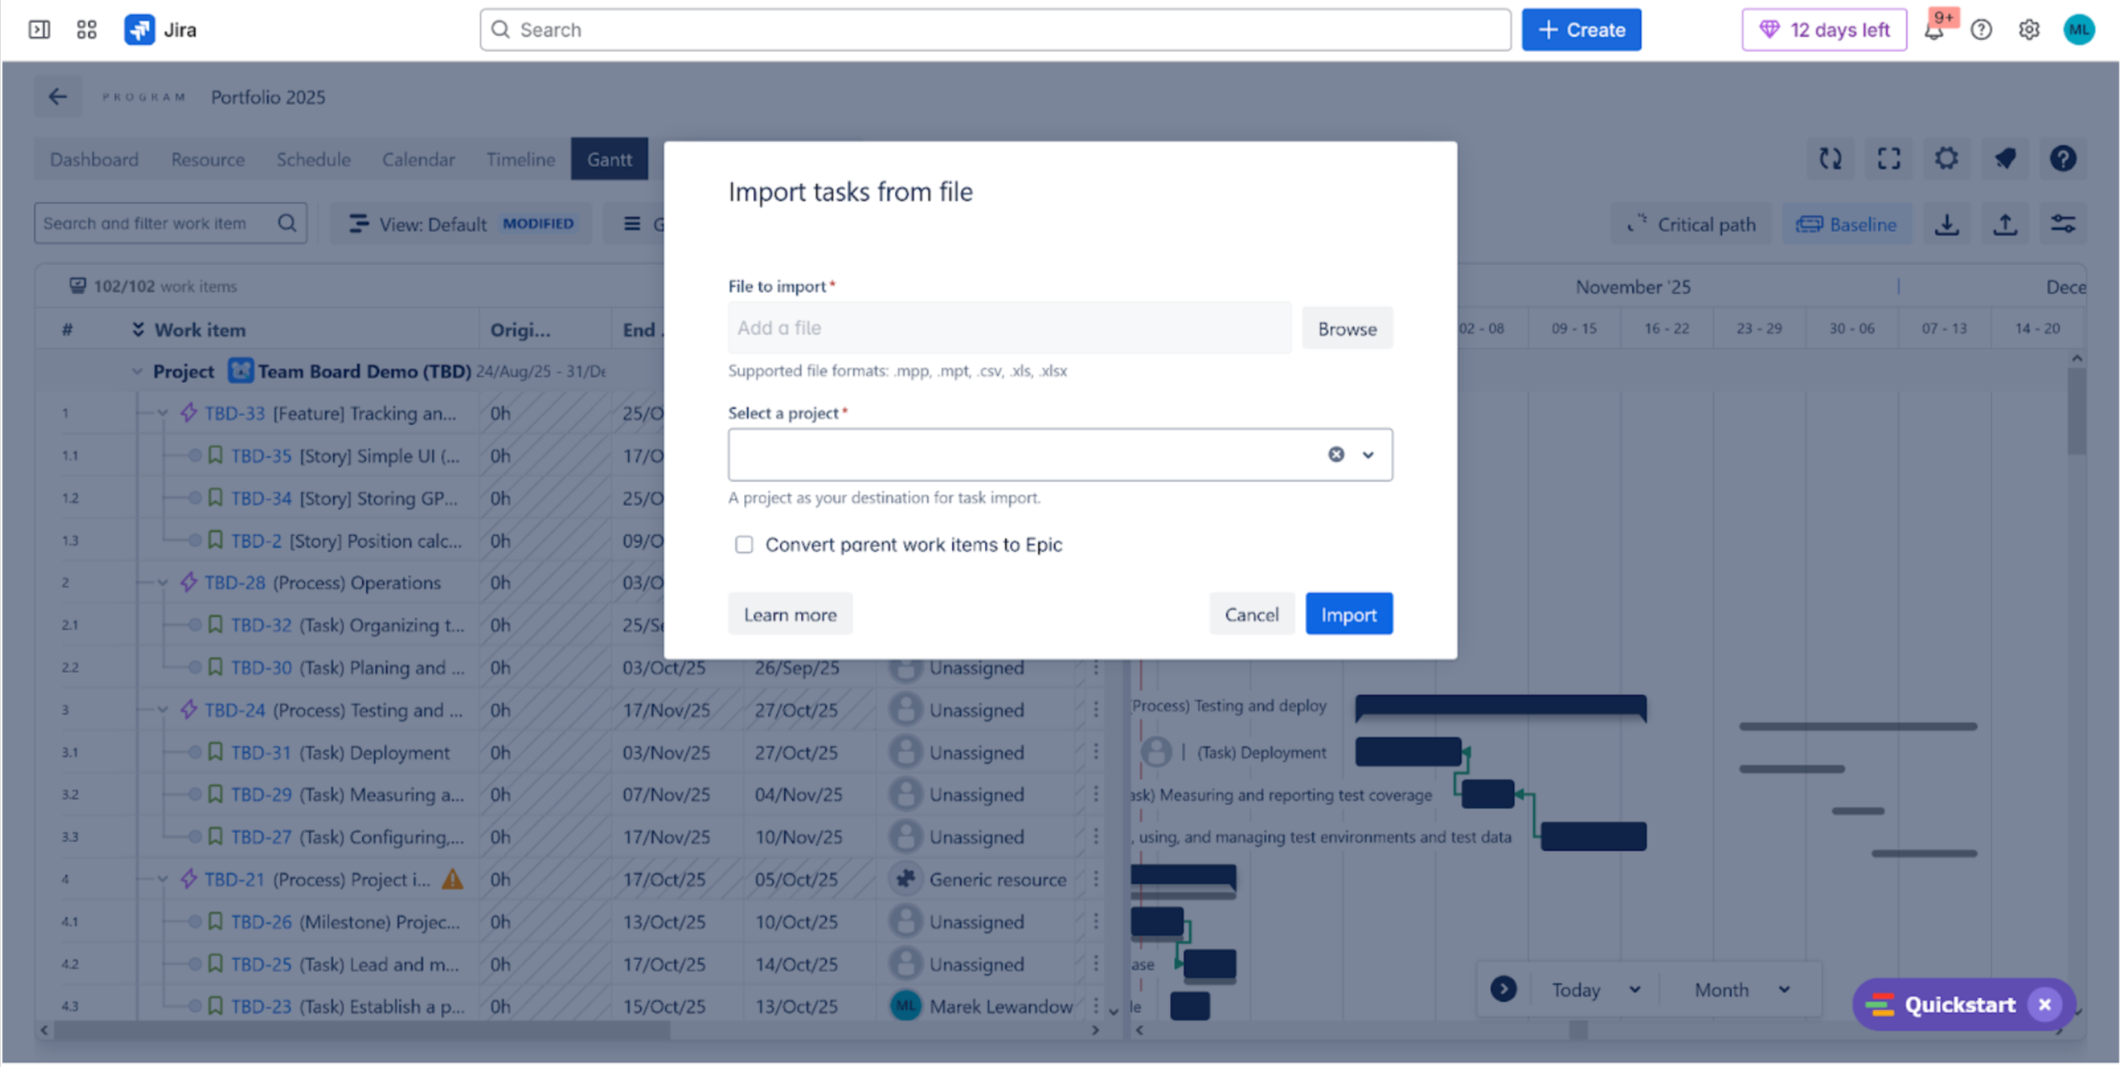
Import / Export
The ability to Import/Export plans (especially to MS Project or Excel) ensures compatibility with external stakeholders and enables offline planning or migration processes.
Seamlessly connect your planning tools with TeamBoard ProScheduler. Effortlessly Import project schedules from external tools like Microsoft Project (.mpp, .mpt) and spreadsheet formats (.csv, .xlsx) to instantly populate your Gantt chart. You can also Export Jira project data with customizable columns for external reporting or collaboration.
App Name
Import/Export Score
Key Data Integration Features
MS Project / Enterprise Value
WBS Gantt-Chart for Jira
⭐⭐⭐⭐ (Leader)
Seamless Import/Export to MS Project; Robust Excel export.
Highest Value (Key Enterprise PMO Feature)
ProScheduler
⭐⭐⭐⭐ (Leader)
Seamless Import/Export to MS Project; Export of selected fields to Excel.
Highest Value (Key Enterprise PMO Feature)
Structure + Structure.Gantt
⭐⭐⭐
Solid Export to PDF and Excel.
Strong functionality for Jira structure visualization.
Jira Plans (Advanced Roadmaps)
⭐⭐⭐
Relies on default Jira Import/Export capabilities.
Native Atlassian solution.
Jira Timeline
⭐⭐⭐
Relies on default Jira Import/Export capabilities.
Native Atlassian solution.
BigGantt
⭐ (Critical Fail)
Requires the purchase of additional companion apps for meaningful import/export.
Lowest Value (Poor Integrated Experience)
The capacity for seamless Data Import and Export is a critical factor for high-level Jira reporting and integration with external Project Management Offices (PMOs) tools, notably Microsoft Project. Our analysis of top Jira Gantt Chart apps revealed that third-party solutions generally offer superior capabilities compared to native tools, with most scores clustering around the ⋆⋆⋆ mark.
For Enterprise PMOs, support for MS Project Integration is non-negotiable. Two applications excelled in this area, earning a top-tier ⋆⋆⋆⋆ rating: WBS Gantt-Chart for Jira and ProScheduler.
WBS Gantt-Chart for Jira was particularly strong, also offering excellent Excel export functionality. ProScheduler scored similarly high but was slightly limited on Excel export, only providing selected fields.
Native Atlassian tools like Jira Plans (Advanced Roadmaps) and Jira Timeline achieved a respectable ⋆⋆⋆, primarily leveraging the built-in Jira default Import/Export mechanisms.
The key outlier for a poor user experience was BigGantt, which scored a low ⋆ due to requiring extra companion apps for any meaningful Jira data import/export, suggesting a less integrated solution in this critical area. If Jira MS Project Integration is vital for your organization, prioritize the ⋆⋆⋆⋆ options or expect extra cost!
UI / UX
The User Interface and User Experience dictate tool adoption. An intuitive design (UX) with features like drag-and-drop scheduling minimizes the learning curve and maximizes daily efficiency.
Visualize your work beautifully with BigGantt’s Best UI/Design. Experience a strong visual interface and intuitive navigation combined with powerful Gantt chart features. It’s the top choice for an excellent user experience in Jira Portfolio Management and gaining deep project insights.
Jira App/Feature
UI Design Score (Visual Appeal)
UX Workflow Score (Ease of Use)
Key UI/UX Differentiator
Jira Plans (Advanced Roadmaps)
⭐⭐⭐
(Decent, functional)
⭐⭐⭐⭐
(Easy to use and add tasks)
Top UX for Planning. High task-entry ease, intuitive Jira Roadmap for alignment. Best for: Agile Planning, Jira Advanced Roadmaps, Easy Jira Task Management.
Jira Timeline
⭐⭐⭐
(Decent, functional)
⭐⭐⭐⭐ (Easy to use and add tasks)
High Adoption Rate. Simple, low-friction task creation. Best for: Simple Jira Scheduling, Intuitive Jira Timeline, Agile Team Adoption.
BigGantt (by BigPicture)
⭐⭐⭐⭐ (Modern, polished)
⭐⭐⭐⭐ (Adding tasks could be easier)
Best UI/Design. Offers a strong visual experience and powerful Jira Gantt Chart features. Best for: Best Jira Gantt Chart UI, Jira Portfolio Management, BigPicture Ecosystem.
Pro scheduler
⭐⭐⭐ (Decent, unpolished)
⭐⭐⭐ (No dedicated Portfolio view)
Mid-Range Utility. Good resource features but lacks high-level Portfolio Planning views. Best for: Jira Resource Planning, TeamBoard Pro Scheduler, Jira Scheduling Tools.
Structure + Structure.Gantt
⭐⭐ (Looks archaic)
⭐⭐⭐ (Steep learning curve)
High-Friction Complexity. Powerful Work Breakdown Structure (WBS) at the cost of modern usability and intuitive drag-and-drop. Best for: Jira WBS Integration, Complex Jira Hierarchy, Structure.Gantt Limitations.
WBS Gantt
⭐⭐
(Looks archaic)
⭐⭐
(Cumbersome task scheduling)
Lowest Usability. Dated interface with workflow friction (cannot click-to-schedule). Best for: Jira WBS Chart, WBS Gantt Review, Jira Scheduling Limitations.
Choosing the best Jira project management app requires balancing modern User Interface (UI) design with efficient User Experience (UX) workflows. The ratings clearly highlight a trade-off between Atlassian’s native ease-of-use and the feature depth of third-party Jira Gantt chart plugins.
For Maximum Ease of Use & Fast Adoption (High UX):
The native Atlassian solutions, Jira Plans (Advanced Roadmaps) and Jira Timeline, stand out with top-tier UX scores (4/5). They are consistently praised for being “Easy to use and add tasks,” which ensures low-friction adoption for new or cross-functional teams. While their UI is merely “Decent,” their focus on intuitive Jira planning makes them ideal for core Agile project management and sprint alignment.
For Best Visual Design & Portfolio Management (High UI):
BigGantt achieves the highest UI rating (4/5), offering a visually polished and feature-rich Jira Gantt Chart experience. As part of the BigPicture ecosystem, it is a stronger contender for Jira Portfolio Management due to its design focus on roadmaps and timelines. The only noted drawback is minor friction in its task creation process.
The Complexity Penalty: Archaic UI & Steep Learning Curve:
Applications that center around the Work Breakdown Structure (WBS), like Structure + Structure.Gantt and WBS Gantt, suffer the lowest scores (2/5). These tools, while powerful for hierarchical structuring, are rated as having an “archaic” UI and demanding a “steep learning curve.”
WBS Gantt specifically hinders daily workflow with a severe UX limitation: users cannot add a task to the timeline by simply clicking, forcing a cumbersome reliance on date setting. This highlights a clear choice: depth of WBS vs. day-to-day usability.
Pro scheduler remains a mid-range option, noted for a lack of a dedicated Jira Portfolio View, which impacts the UX for managers needing a consolidated view of multiple projects.
Limitations
Understanding hard technical limits (e.g., Maximum 5,000 issues per plan) is essential. This information dictates the tool’s scalability and whether it can handle the organization’s growth without performance degradation.
App
Rating (1-5)
Provided Information Summary
Rationale
BigGantt
⭐⭐⭐⭐
(Leader)
“Sole focus is timeline visualization, roadmapping, and basic task scheduling.” Its focused nature is a “limitation” if “PPM, advanced resource… or dedicated risk management” is required.
It is robust and excels at its core function (Gantt/Timeline) but is explicitly limited in its scope for advanced PPM.
Structure + Structure.Gantt
⭐⭐⭐⭐
(Leader)
Limited in “Comprehensive PPM Features” (lacks dedicated Risk Matrix, SAFe PI Planning). “Less Advanced Resource Management.” Performance “slower on large structures.”
Highly flexible for hierarchy but is fundamentally limited in dedicated PPM/Resource features, putting it squarely in the middle of the feature-breadth scale.
WBS Gantt
⭐⭐⭐
Updates improved performance, and some documentation claims “no issue limit,” but some users still find performance “less optimal” with “tens of thousands of issues.” ( Focuses on WBS, Gantt, Critical Path, Baselines, and Resource Monitoring with alerts, but typically lacks advanced portfolio/risk modules found in comprehensive PPM suites.
It includes Critical Path and Smart Workload Allocation/Resource Monitoring, placing it a step above basic Gantt tools. However, like BigGantt and Structure.Gantt, it is still primarily a powerful Gantt tool and is not typically considered a full PPM suite with dedicated risk, program, and financial modules. We’ll round up as it specifically includes “Enterprise-Grade Capabilities” and resource monitoring beyond simple task assignment.
Pro scheduler
⭐⭐⭐
Has “Limited Integrations” (Tempo, BigPicture, Jira Plans) and “No Public REST API,” which restricts custom automation. Has a “Multi-Assignee Constraint” with native Jira fields.
The significant technical limitations (No API, Limited Integrations) severely restrict its power and usability within a broader hybrid/enterprise toolset.
Jira Plans
⭐⭐
Advised maximum of 5,000 issues per plan. Cannot span more than 100 projects. Performance degrades above 50 teams. Max of 4 work sources recommended.
Despite being an advanced Atlassian feature, the numerous, specific, and relatively low technical limits (5k issues, 100 projects) severely restrict its use in large-scale, enterprise-level hybrid/PPM environments.
Jira Timeline
⭐
(Lowest)
No specific information was provided for this tool.
There is no provided text snippet to rate the limitations or features of “Jira Timeline.”
Choosing the Best Jira Gantt Chart & PPM Tool: Limitations & Scalability
When building a successful Jira project management setup, understanding tool limitations is crucial for scaling your business. This guide details the constraints of popular Jira Gantt chart and Portfolio Management (PPM) solutions, helping you avoid workflow blocker
BigGantt & Structure.Gantt: Feature Gaps for PPM
These tools are strong at their core function but have key feature gaps for high-level portfolio management.
BigGantt: Its primary constraint is its focused nature. It’s a robust tool for basic Gantt chart visualization and roadmapping in Jira, but its lack of dedicated Project Portfolio Management (PPM), advanced resource/capacity management, and cross-project reporting means an upgrade to BigPicture is necessary for high-level enterprise oversight.
Structure + Structure.Gantt: The limitations stem from its core design as a flexible hierarchy builder (WBS). Key gaps include the lack of native, built-in PPM features (e.g., Risk Matrix or SAFe PI guidance) and less advanced resource management features for detailed workload balancing. Furthermore, while the tool handles huge data sets, performance can noticeably slow down on massive structures with high concurrent user volume.
WBS Gantt-Chart: Scalability Concerns
WBS Gantt-Chart for JIRA is a powerful tool for Work Breakdown Structure, including advanced planning features like Critical Path and Smart Workload Allocation/Resource Monitoring.
Its limitation lies in performance at scale. Some users find it slower than competitors when dealing with tens of thousands of issues or highly complex data sets, despite vendor claims of no issue limit.
Pro scheduler: Technical & Integration Constraints
For teams considering Pro scheduler, the limitations are primarily technical and integration-focused.
It suffers from limited integrations with major Jira marketplace add-ons (like Tempo or BigPicture), and the lack of a public REST API restricts custom automation.
A specific planning limitation is that multi-assignee scheduling is only possible using the app’s internal date fields, not standard Jira date fields.
The built-in Atlassian features have clear hard-coded capacity limits, making them unsuitable for managing large, complex Jira portfolios.
Jira Plans (Advanced Roadmaps): Has a strict advised maximum of 5,000 issues per plan, cannot span more than 100 Jira projects, and performance degrades significantly beyond 50 teams or four work sources.
Jira Timeline (Basic Roadmap): Has a maximum display limit of 5,000 work items, with a sub-limit of only 500 parent items (Epics).
V. Performance at scale
Performance at Scale:
An enterprise-grade PPM solution must maintain high performance even when processing thousands of underlying Jira issues across multiple projects, preventing system slowdowns that hinder adoption.
App
Performance at Scale Rating (1-5)
Explanation
BigGantt
⭐⭐⭐⭐
(Leader)
Robust for its focused scope, performance is strong for timeline visualization and basic scheduling, but scaling up to full PPM enterprise data sets often requires the full BigPicture suite.
Structure + Structure.Gantt
⭐⭐⭐⭐
(Leader)
Designed to handle large data sets and custom hierarchies (up to 100k issues); however, performance can noticeably slow down on massive structures with high concurrent user volume.
WBS Gantt
⭐⭐⭐
While updates improved performance, some users still find it less optimal compared to competitors when dealing with tens of thousands of issues or extremely complex data sets.
Pro scheduler
⭐⭐⭐
Its performance is generally adequate but its limited integrations and no public API restricts its ability to integrate with and optimize large-scale enterprise workflows and data streams.
Jira Plans
⭐⭐⭐
Has a strict advised maximum of 5,000 issues per plan. Exceeding this limit severely impacts performance and responsiveness, making it poor for very large portfolios but adequate up to its limit.
Jira Timeline
⭐⭐
(Lowest)
A basic, single-project tool with a low advised maximum of 5,000 work items (sub-limit of 500 parent items). It is not designed to scale to the demands of large, complex cross-project portfolios.
A successful Jira project management setup requires choosing a tool whose limitations won’t block your team’s essential workflows, particularly regarding performance at scale and PPM feature set.
High Performers for Core Gantt/WBS (4/5):
BigGantt earns a high score for performance within its focused scope. It is robust for basic timeline visualization and roadmapping. However, scaling its function to full enterprise-level Project Portfolio Management (PPM) often requires upgrading to its sister product, BigPicture.
Structure + Structure.Gantt also scores well due to its design for handling massive data sets and highly customized hierarchies. The main constraint at scale is a noticeable performance slowdown under extremely high concurrent user volume on the largest structures.
Average Scalability with Caveats (3/5):
WBS Gantt is powerful for WBS and critical path planning but is mid-range for pure performance at scale. Some users find it less optimal than competitors when dealing with tens of thousands of issues, despite vendor claims of no issue limit.
Pro scheduler is constrained less by pure technical performance and more by integration. Its lack of a public REST API and limited integrations restrict its ability to fully optimize and automate large-scale enterprise workflows.
Jira Plans (Advanced Roadmaps) is limited by a strict, hard-coded capacity ceiling. While it performs adequately up to its advised maximum of 5,000 issues per plan, exceeding this limit severely impacts responsiveness, making it poor for very large portfolios.
Low Scalability (2/5):
Jira Timeline scores low because it is a basic, single-project tool with a strict limit of 5,000 total work items. It is simply not designed to scale to the demands of complex, cross-project portfolio management.
Jira PPM Tool Showdown: Summary of the Best Gantt & Roadmapping Apps
Looking for the best Jira Gantt chart app or Project Portfolio Management (PPM) tool? Our in-depth 2025 comparison reveals clear winners for teams needing professional planning beyond Jira’s native features.
Key Comparison Findings:
Top Performer for Gantt Power:BigGantt scored the highest overall (72%), proving it’s the most robust solution for core Gantt chart functionality, dependency management, and automatic date updates.
Best for Portfolio & Features:Structure + Structure.Gantt came in a close second (69%), excelling in the wider PPM feature set, including superior resource management, advanced warnings, and robust formula/auto-calculation capabilities.
Budget vs. Features: While Jira Plans (Advanced Roadmaps) and Jira Timeline are free or built-in, they scored the lowest (51% and 45% respectively). Our data shows that for serious enterprise planning, critical path analysis, and scenario modeling, a dedicated, high-rated marketplace app is essential.
User Rating Favorite:Pro Scheduler boasts the highest user rating (3.5/4), combining strong performance on features like Baselines with a highly-rated user experience.
Choosing the wrong PPM tool can introduce more complexity and cost. Don’t let a bottlenecked, unoptimized workflow sabotage your next project.
🔥 Want to stop guessing and start transforming? 🔥
If you’re already feeling the drain of an inefficient toolstack, our experts can help you diagnose and fix the problem fast. We’ve opened up exactly 2 slots this month for a free 15-minute “Is This Fixable?” call.
For more insights and in-depth guidance on selecting and implementing the best PPM tools for Jira, contact our team, or explore our YouTube videos. With the right configuration, BigPicture can transform your project management experience, making scheduling smoother, more intuitive, and far less time-consuming. With the right tools and configuration, you can transform your project portfolio management experience, making planning, execution, and reporting smoother, more intuitive, and far less time-consuming.
Login to Genius Gecko
Reset Password
Enter the username or e-mail you used in your profile. A password reset link will be sent to you by email.


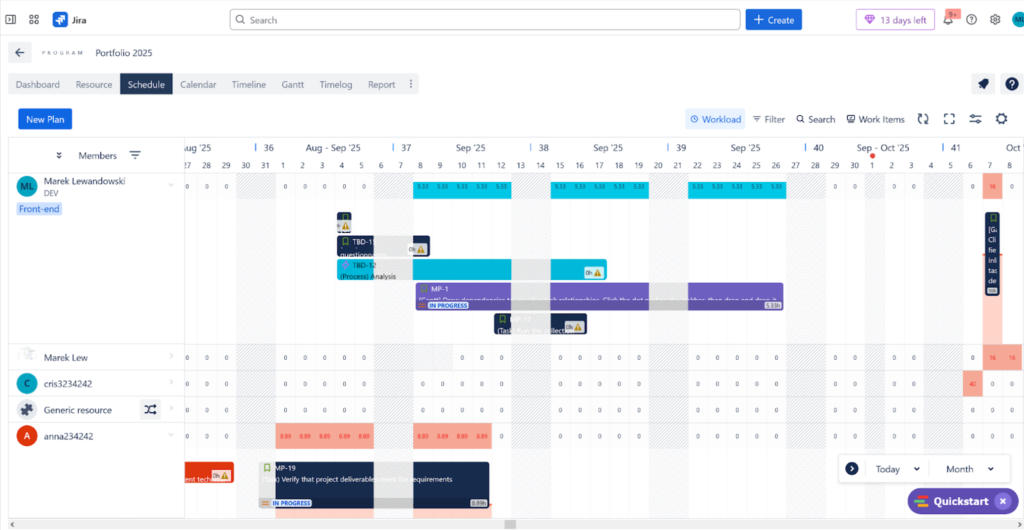 Visualizing TeamBoard ProScheduler’s comprehensive Resource Management dashboard. The display highlights color-coded workload views, instantly showing overloaded, balanced, and underutilized team members. Jira Project Managers can leverage the Schedule Board to use drag-and-drop allocation, set custom team capacity, and factor in time off and holidays to ensure optimal, cross-project resource distribution.